When individuals consider relocating, the questions they ask are rarely abstract. They are immediate and practical in nature: Can I afford to live well there? Will I feel safe? Is the air clean? Can I access high-quality healthcare, communicate with ease, and travel when I need to? And, equally important, will I feel comfortable settling in? These are the questions this ranking is designed to answer.
Livability indices have traditionally been designed to support corporate mobility decisions. This briefing takes a different approach: its primary objective is to guide individuals making independent choices about where to live. At its core, it asks a simple question – how objectively livable is a city for a prospective expat?
The context matters. Today, more than 300 million people live outside their country of birth. The number of international migrants reached 304 million in 2024, nearly double the 154 million recorded in 1990 (UN DESA, 2025). The post-pandemic decade has accelerated this shift further, producing a more diverse group of internationally mobile individuals, including remote workers, retirees, digital entrepreneurs, and location-independent families, each with distinct priorities.
This briefing evaluates 35 globally diverse cities and identifies the most livable destinations for expats among them. Alongside core indicators such as safety, healthcare, and cost of living, it incorporates enhanced mobility and expat integration environment – two dimensions that are rarely measured but consistently matter to those navigating a relocation. The result is a practical tool for individuals, private clients, and advisors making international relocation decisions.
[gcs_livable_cities_map]
City Selection
The 35 cities were selected based on their relevance to active relocation decisions rather than prestige or population size. The list spans Europe, Asia, Latin America, Africa, the Middle East, and Oceania, and includes both established relocation hubs and destinations that may be undervalued in current relocation discourse.
What This Index Measures
The cities are evaluated across seven indicators selected for their practical relevance to voluntary relocators: cost of living, personal safety, air quality, healthcare quality, ease of settling in, English proficiency, and enhanced mobility.
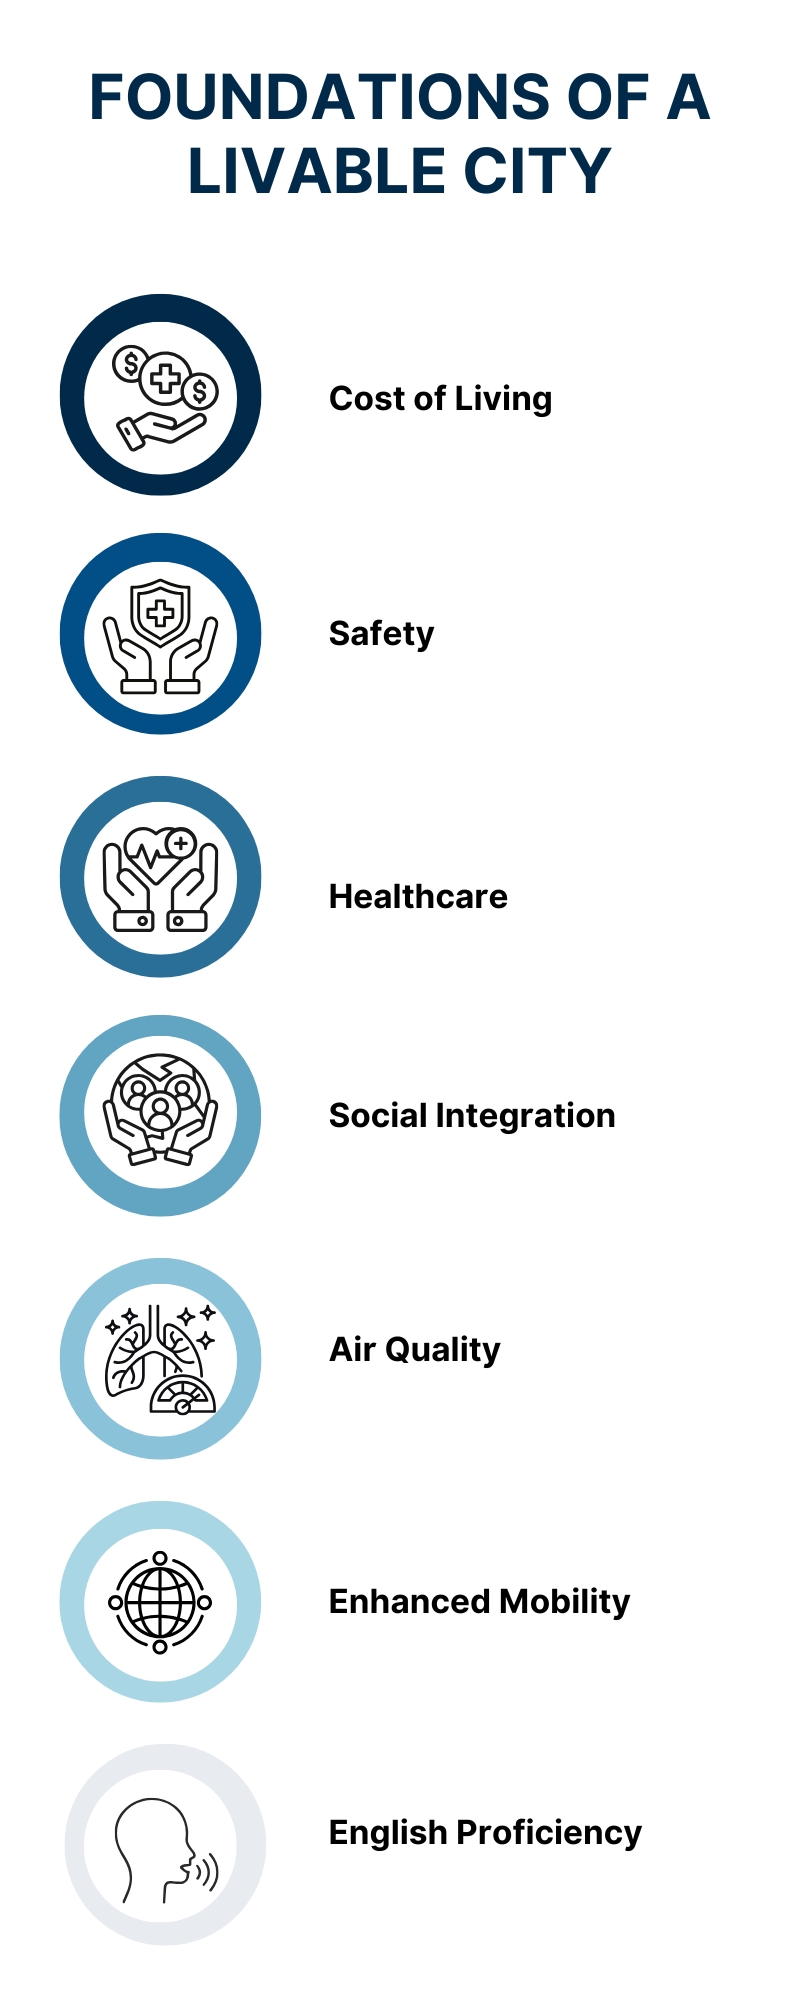
Five indicators, including cost of living, safety, air quality, healthcare, and ease of settling in are measured at the city level, while two – English proficiency and enhanced mobility – are measured at the country level. All indicators are drawn from publicly available, regularly updated datasets (including Numbeo, IQAir, and the EF English Proficiency Index) and normalized using a 0–100 min–max scale, where higher values always indicate better outcomes.
Indicators are weighted to reflect their relative importance in relocation decisions, with safety and healthcare receiving the highest weight at 18% each, followed by cost of living (17%) and air quality (15%), while integration environment (12%), English proficiency (10%), and enhanced mobility (10%) are assigned moderate weight as factors shaping long-term relocation outcomes.
Novelty
Two indicators represent a departure from traditional livability frameworks.
Enhanced Mobility indicator captures the structural freedom associated with nationality. The values for this variable are derived from the Global Passport Index, developed by Global Citizen Solutions. It reflects not only the number of visa-free or visa-on-arrival destinations, but also their relative desirability, capturing the strategic value of mobility and its role in expanding where individuals can live and work.
Expat Friendliness captures the lived experience of relocation, focusing on ease of settling in and social integration based on expat survey data derived from InterNations.
Thus, what distinguishes this index from existing livability frameworks is the integration of mobility and expat experience alongside core urban indicators, making it a composite tool designed specifically for globally mobile individuals.
Limitations
The index is designed as a structured comparative tool rather than a fully comprehensive evaluation. The 35 cities represent a curated selection of relevant relocation destinations across the world, and the indicators rely on publicly available data, including survey-based measures. Certain dimensions such as tax frameworks, housing markets and education are not included in this edition and remain areas for future development.
Defining Livability
Livability has become an increasingly important concept in how cities are planned and developed, often used to guide long-term priorities and decision-making at both local and national levels.
It appears across a wide range of areas, from transportation and infrastructure to community development and urban resilience, which reflects its broad and flexible nature (Herrman & Lewis, 2017). At its core, livability refers to the overall quality of life a city offers and its ability to support the well-being of its residents. However, describing a “livable” city often comes close to outlining an ideal: such places are typically expected to be safe and secure, supported by reliable infrastructure and high-quality public services, economically stable, and environmentally sustainable (Kaal, 2011). This combination of practical criteria and aspirational qualities explains why livability has become a central, yet sometimes loosely defined, concept in discussions about where and how people choose to live.
In the context of this briefing, livability is no longer only a descriptive concept but an increasingly important framework for understanding how individuals evaluate potential destinations in a global mobility landscape.
The Evolving Structure of International Mobility
Traditional livability assessments were built with a purpose to evaluate cities for established residents or corporate transferees. However, the people moving today are a different population, with different priorities. This is a considerable change, as the number of people living outside their country of birth has nearly doubled since 1990, reaching 304 million in 2024, as shown in the chart below. It is worth noting that not all individuals reflected in these figures are voluntary migrants. UNHCR estimates that 123.2 million people were forcibly displaced by the end of 2024, including 42.7 million refugees who do not freely choose their destination. Even accounting for this distinction, the broader trend remains clear: international migration flows continue to expand year on year.
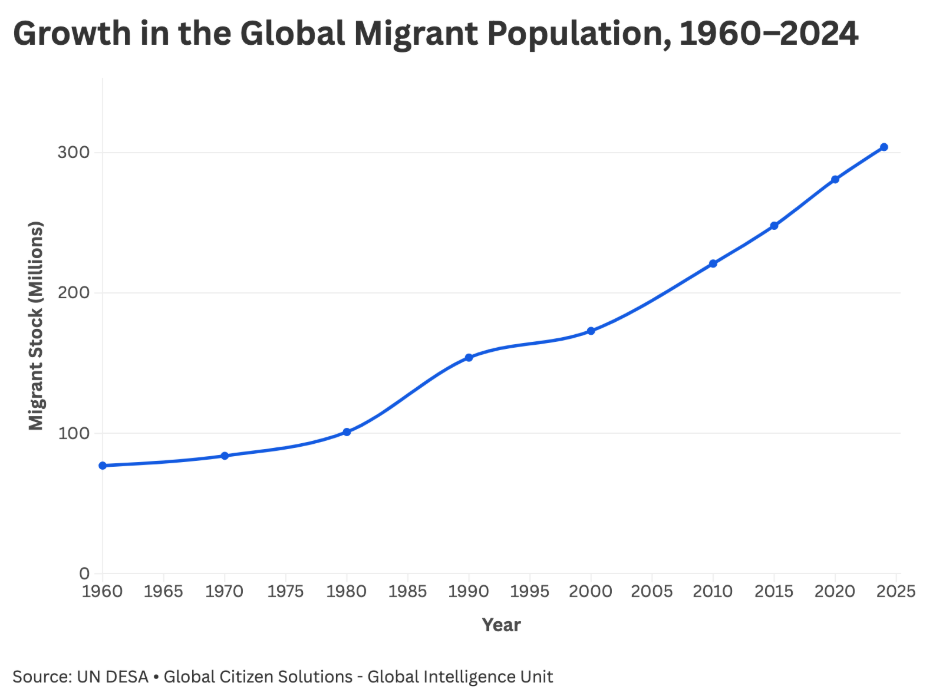
Chart 1. Migrant Population Increase Across the Globe
Moreover, OECD data shows that permanent migration to member countries exceeded 6.5 million in 2023, the latest year with fully comparable data, representing a 28% increase compared to 2019, while preliminary estimates suggest flows remained elevated at around 6.2 million in 2024 (OECD, 2024, 2025).
At the same time, migration is becoming more diverse in its drivers and structure: family migration accounted for 43% of inflows, pointing to a growing share of moves linked to long-term settlement rather than purely labor demand (OECD, 2024).
Alongside these established patterns, more recent forms of mobility have emerged, particularly those enabled by remote work. For example, digital nomads, individuals able to work independently of location, represent a distinct and economically relevant segment, with 79% earning over USD 50,000 annually (Global Citizen Solutions, 2025). Taken together, these developments indicate a more heterogeneous mobility landscape, in which relocation decisions are shaped not only by employment opportunities but also by a broader evaluation of lifestyle, flexibility, and long-term living conditions.
01/ The Affordability Trap: cost advantage rarely travels alone
Cost of living is consistently identified as one of the primary drivers in relocation research when it comes to destination choice, and the cities leading on this dimension are quite diverse geographically. Ho Chi Minh City is the most affordable city in the ranking, followed by Nairobi, Bali, and Tbilisi. However, none of these countries reach the top half of the composite ranking, as the framework weighs several other dimensions that move in different directions.
A closer look reveals that the most affordable cities often lack adequate healthcare access, transit options, or consistent personal safety. Bali and Tbilisi score below the top-ten average on healthcare; Ho Chi Minh City and Bali rank toward the lower end of the mobility index; Nairobi and Ho Chi Minh City exhibit more variable safety conditions. These findings do not undermine affordability but instead help clarify the type of relocator each city is best suited for.
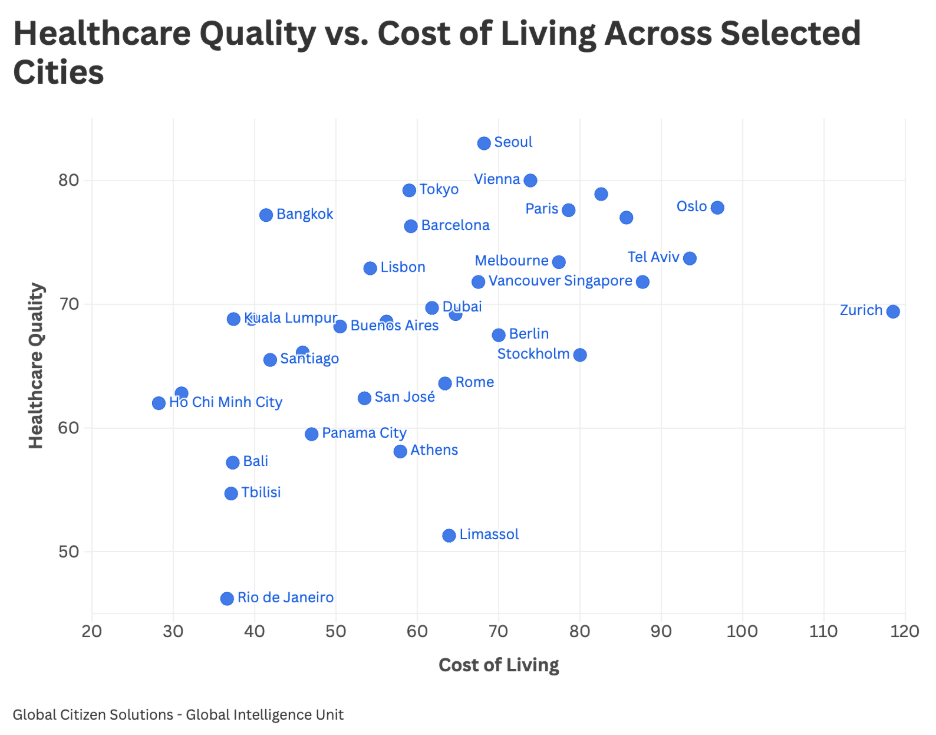
Chart 2. Healthcare Quality Relative to Cost of Living Across 35 Cities
The chart maps all 35 cities by cost of living and healthcare quality. The distribution shows that the two dimensions vary independently, with affordability and healthcare strength rarely aligning in the same destination.
For digital nomads, retirees, and entrepreneurs whose financial flexibility is the central consideration, cities like Tbilisi, Bali, and Bangkok offer genuine advantages: low operating costs, established expat communities, and lifestyle conditions that align well with location-independent work. What the data does challenge is the assumption that affordability functions as a foundation on which other livability factors can be layered. In this sample, affordability and structural strength tend to vary independently, and each relocator’s profile determines which combination matters most.
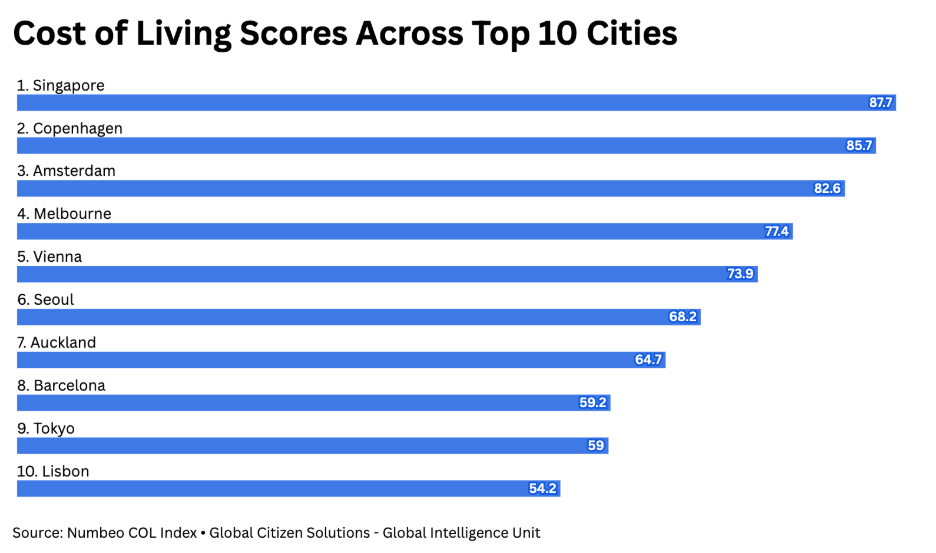
Chart 3. Cost of Living in Top 10 Cities
02/ The Welcome Gap: feeling welcomed and living well are not the same thing
The cities that score highest on social integration are rarely the cities that score highest overall, and the divergence is consistent enough to warrant attention. The InterNations Ease of Settling In Index measures three dimensions of social integration: local friendliness, ease of finding friends, and how welcoming the culture feels to newcomers. San José in Costa Rica records the highest ease-of-settling-in score in the ranking, followed closely by Mexico City, Bali, Rio de Janeiro, and Bangkok. Of these, only San José (14th) places in the top half of the composite ranking.
The qualities that make a city feel welcoming to newcomers are structurally distinct from indicators such as healthcare quality and air quality. A city can be socially accessible, bureaucratically navigable, and rich in expat community while simultaneously offering more limited healthcare infrastructure or higher pollution levels. These are not contradictions but distinct dimensions of livability that do not correlate.
The inverse pattern is equally evident. Vienna ranks 4th overall while recording one of the lowest ease-of-settling-in scores in the ranking; Copenhagen and Amsterdam, ranked 9th and 2nd, are not far behind. These cities perform exceptionally on healthcare, safety, and air quality, but offer comparatively less in the way of immediate social ease. Thus, structural excellence and ease of social integration are best understood as complementary rather than substitutable considerations.
03/ The Single-Indicator Illusion: leading on one measure is not the same as leading overall
A third pattern reinforces the first two: cities that lead on a single indicator almost never lead the composite. Dubai records the safest score in the ranking yet ranks 19th overall, constrained by low air quality levels and a comparatively weaker performance on English proficiency. Panama city has the cleanest air in the sample but ranks 13th, with healthcare scores limiting its overall position. Seoul records the highest healthcare score in the sample but ranks 10th, with weaker air quality and English proficiency constraining its broader profile.
The pattern extends to the cities that lead the index. Lisbon, ranked 1st, does not lead on any single indicator, as its strongest dimensions are mobility and English proficiency, both of which are exceeded by several other cities. What distinguishes Lisbon is that it performs above average on every dimension, with no significant weakness anywhere in its profile. The same balance characterizes Amsterdam (2nd), Melbourne (3rd), and Vienna (4th): consistent above-average performance across the board, rather than dominance in any single area.
For relocators, this carries a practical implication. A city optimized for one priority – safety, clean air, or world-class healthcare, typically achieves that excellence at the cost of weaker performance elsewhere. Taken together, these patterns point to a broader structural divide. When the data is aggregated at the regional level, distinct profiles of livability begin to take shape.
04/ The Regional Profile: livability looks different in every region
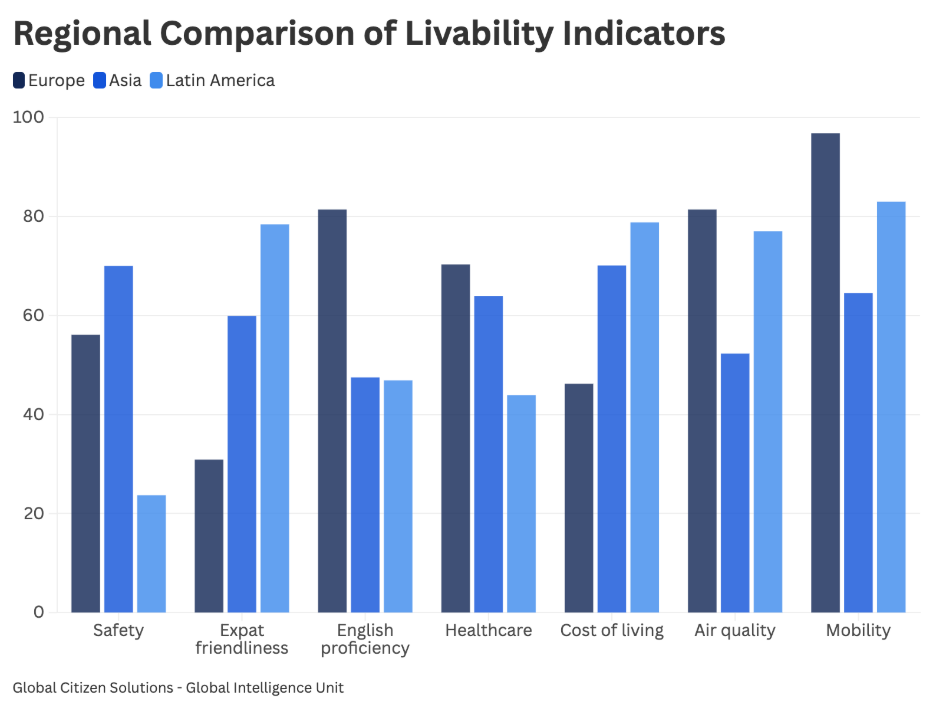
Chart 4. Regional Averages of Seven Indicators
Considering this regional setting, Europe leads on structural and institutional factors, particularly mobility, English proficiency, healthcare, and environmental quality, reflecting strong infrastructure and global accessibility. However, it underperforms when it comes to affordability a expat friendliness, indicating that high living standards are offset by comparatively higher costs and weaker social integration.
Asia presents a more balanced profile. It performs strongly on safety and maintains moderate outcomes across most other indicators, though it lags behind Europe in mobility and English accessibility and behind Latin America in affordability and ease of integration.
Latin America stands out for affordability and social integration, outperforming both Europe and Asia on these dimensions. Cities such as Panama City, San José, and Buenos Aires illustrate this pattern, combining relatively low living costs with high expat friendliness scores in the sample. However, these advantages are offset by weaker performance in safety and healthcare, highlighting a trade-off between cost, integration, and institutional quality across regions.
The chart below presents the full composite ranking of all 35 cities included in the index.
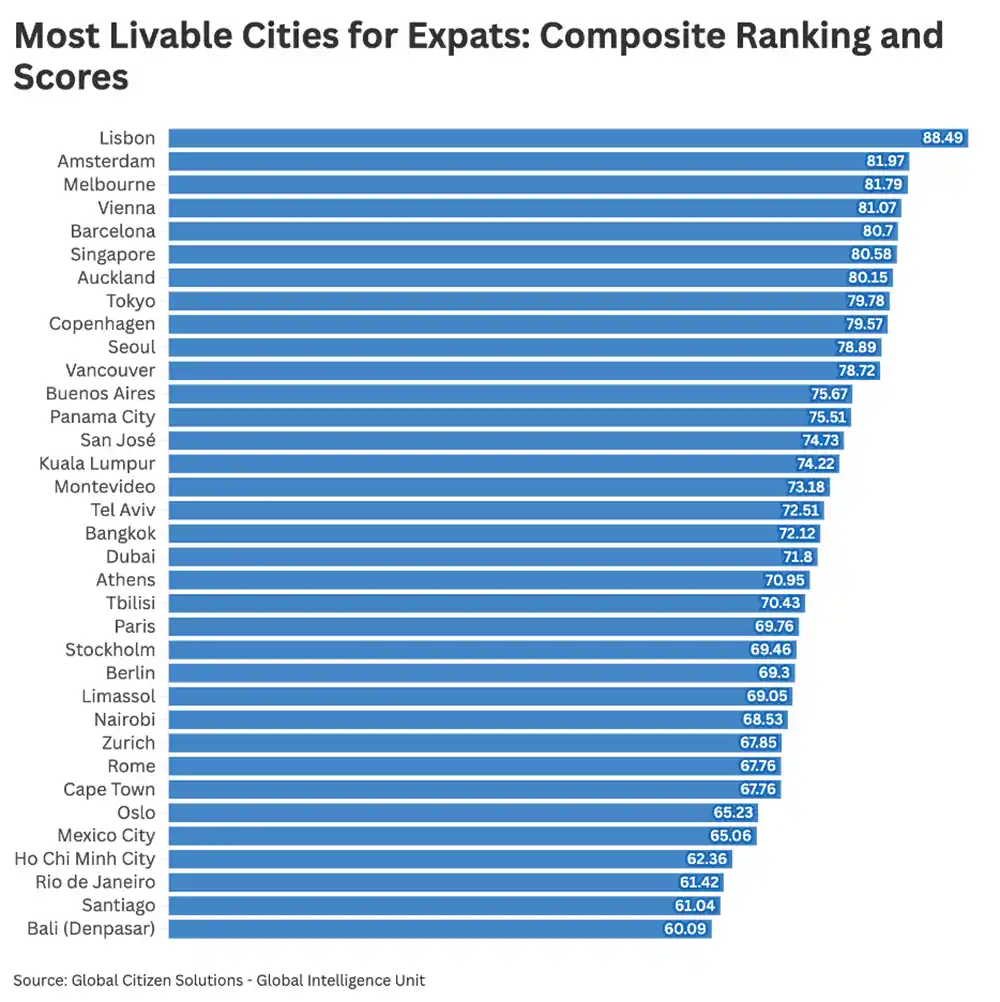
Chart 5. Full Ranking and Composite Scores of Livability Index
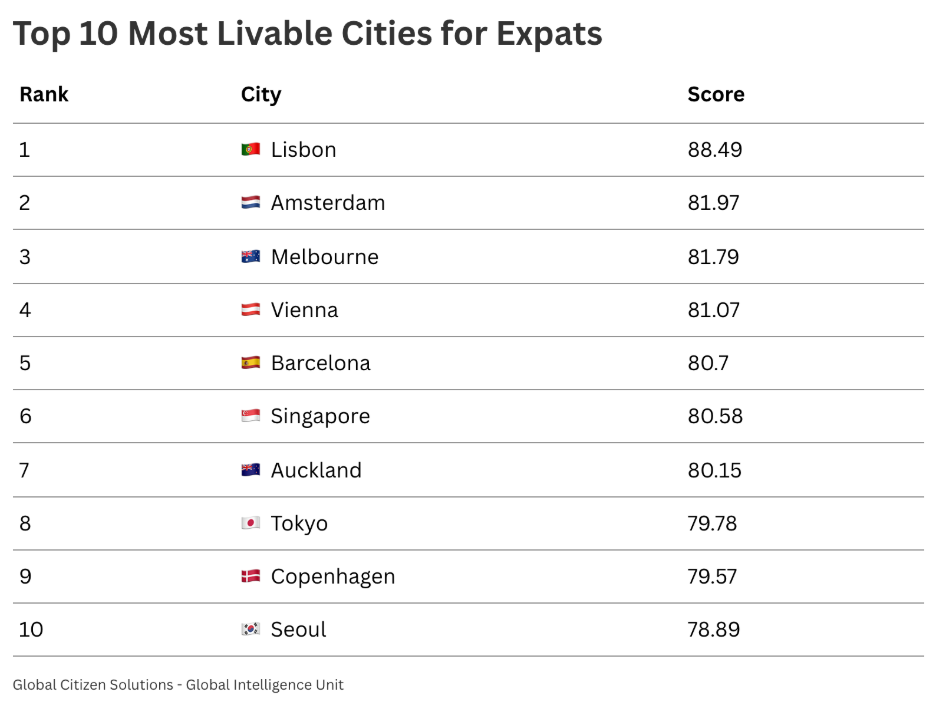
A detailed analysis of the top 10 performers follows in the table and section presented below.
01/ Lisbon, Portugal

Lisbon leads the index due to its consistently strong performance across all indicators, rather than dominance in any single category. This is reinforced by relative affordability: Lisbon is among the least expensive capitals in the index, well below Vienna, Amsterdam, and Copenhagen on cost of living. Quality-of-life indicators are similarly strong. Air quality places Lisbon among the cleaner cities in the sample, while its safety score exceeds that of several other major European destinations, including Barcelona, Paris, and Rome. Although Lisbon does not lead any individual metric, it combines comparatively low living costs with broadly strong performance across infrastructure, environmental, and mobility indicators. For internationally mobile residents, this profile is reinforced by multiple legal pathways to residency, including residence-by-investment and digital nomad visa options, which further enhance Portugal’s positioning relative to other European jurisdictions.
02/ Amsterdam, Netherlands

Amsterdam ranks second in the index, supported by strong performance across the indicators most relevant to long-term residents. High safety, high-quality healthcare, and clean air together produce a consistently high overall score. The city also stands out for its accessibility for international residents, recording the highest English proficiency level among European cities in the index and reducing language barriers across daily life and administrative processes.
Amsterdam is not only highly international but also exceptionally easy to navigate without a car: walking, cycling, and public transport accounted for around 72%–77% of trips between 2015 and 2022, underscoring its appeal for car-free expat living (Qonita et al., 2025).
The principal trade-off is cost. Amsterdam is among the more expensive cities in the sample, which may limit its appeal for lower-budget residents. Its ease-of-settling-in score further indicates that social integration can take time. Despite these constraints, Amsterdam offers a well-rounded and stable living environment, making it one of the most complete packages in the index for those able to sustain its cost level.
03/ Melbourne, Australia

Melbourne ranks as the highest-performing city outside Europe, supported by strong outcomes across several key indicators. It records the highest English proficiency level in the sample (alongside Singapore, Auckland, and Vancouver) and ranks among the cleanest cities in the sample on air quality. These factors contribute to a living environment that is both accessible and environmentally strong.
Melbourne’s broader appeal lies in the consistency of its institutional and social infrastructure. High-quality healthcare, stable governance, and well-developed urban systems support a reliable standard of living, particularly for residents relocating from other English-speaking countries. The principal constraint is safety, which is comparatively lower than that of European cities in the top ten and represents the main weakness in an otherwise balanced profile.
04/ Vienna, Austria

Vienna ranks fourth in the index and stands out for its strong performance in healthcare, where it records the highest score among European cities in the ranking and is surpassed globally only by Seoul. This contributes substantially to its overall ranking and reinforces its reputation as a stable and well-functioning urban environment.
Beyond healthcare, Vienna combines high institutional quality with manageable living costs relative to other northern European capitals, comfortably below Amsterdam, Copenhagen, and Oslo on cost of living. Its English proficiency is among the highest in the region, supporting accessibility for international residents, while the city’s extensive public transport system and large share of green space further contribute to day-to-day livability.
The principal limitation reflected in the data is ease of settling in, where Vienna records the lowest score among the top ten cities. This indicates that social integration may take longer for newcomers, even where the underlying infrastructure and quality-of-life conditions remain strong.
05/ Barcelona, Spain

Barcelona ranks fifth in the index, supported by balanced performance across multiple indicators rather than a single standout strength. It combines solid healthcare, relatively clean air, and a high level of international mobility, producing a stable overall profile.
A key differentiating factor is its ease-of-settling-in score, the highest among European cities in the top ten. Barcelona is one of Europe’s most internationally mixed cities: foreign nationals account for 26.4% of the city’s population, giving newcomers access to a large and diverse international community (Barcelona City Council, 2025). Compared to other leading destinations, Barcelona offers a more accessible social environment for newcomers.
Its cost of living is also moderate relative to higher-ranked cities such as Amsterdam and Vienna, reinforcing its appeal for residents seeking a balance between affordability and quality of life. Spain also offers a non-lucrative visa pathway, which permits financially independent individuals to reside in the country without employment, further supporting Barcelona’s accessibility for international residents.
The primary limitation is safety, where Barcelona records the lowest score among European cities in the top ten, reflecting weaker performance on this indicator compared to peers. Despite this, the city’s combination of accessibility, infrastructure, and cost positions it as a well-rounded option within the index.
06/ Singapore, Singapore

Singapore ranks sixth in the index and stands out for its strong performance across several structural indicators. It records the highest mobility score in the index and shares the highest English proficiency level alongside Melbourne, Auckland, and Vancouver, making it one of the most accessible environments for international residents in terms of both movement and day-to-day communication. Its safety score is also among the highest in the sample, contributing to a stable and predictable living environment.
A defining feature of Singapore is its long-established role as a global hub for international business and finance, supported by internationally oriented institutions and a regulatory environment well adapted to foreign professionals. Singapore’s global connectivity is a major expat advantage: Changi Airport was named the World’s Best Airport in 2025 by Skytrax, marking the 13th time it has received the title (Skytrax, 2025).
The primary constraint is cost. Singapore is the most expensive city in the top ten, which limits accessibility for lower- and middle-income residents. Air quality, while acceptable, is less competitive compared to other leading cities in the index. Its ease-of-settling-in score is in the middle of the overall sample, indicating that while the structural environment is well suited to international residents, the lived experience of social integration is more variable than the city’s hub status alone might suggest.
07/ Auckland, New Zealand

Auckland is seventh in the index, owing to its strong environmental performance and welcoming environment for foreigners. The city has some of the cleanest air in the ranking, and like Melbourne, Singapore, and Vancouver, it offers the advantage of broad English proficiency.
Overall, it is a stable, lower-density city, with living costs noticeably below Melbourne’s and a healthcare score that, though the weakest among the top ten, still meets everyday needs. The principal limitation is safety, one of the lower scores within the top ten alongside Barcelona and Melbourne, which may influence perceptions of day-to-day security relative to higher-ranked cities. Despite this, Auckland’s balance of environmental quality, accessibility, and cost positions it as a competitive option within the index.
08/ Tokyo, Japan

Tokyo ranks eighth in the index, supported by strong performance in safety and healthcare. Its safety score is among the highest in the sample, slightly above several European countries. Its healthcare score places it among the leading cities globally on this indicator, and together these factors contribute to a stable and reliable living environment.
A defining feature of Tokyo is access to Japan’s strong healthcare system, which is built on universal health coverage through a mandatory public insurance framework and allows residents broad choice of medical providers (Commonwealth Fund, 2026).
Tokyo’s foreign resident population is growing: as of 1 January 2026, Tokyo had 783,701 foreign residents, up from 721,223 one year earlier, an increase of 62,478 people; the largest nationality groups were Chinese, Korean, Nepali, Vietnamese, Myanmar, and Filipino residents (Tokyo Metropolitan Government, 2026).
The principal constraint is language accessibility. Tokyo records the lowest English proficiency in the top ten, which can present challenges for international residents in daily interactions and administrative processes. Despite this, its combination of safety, healthcare quality, and cost efficiency positions it as a distinctive option within the index.
09/ Copenhagen, Denmark

Copenhagen ranks ninth in the index, with strong underlying performance across most core indicators. High safety, strong healthcare, clean air, and one of the highest mobility scores in the index contribute to a well-developed and stable urban environment. Its English proficiency is among the highest in Europe.
Copenhagen remains one of the world’s strongest cycling cities: around 150,000 people cycle each day to work or educational institutions in the City of Copenhagen, representing a 36% modal share of all trips (Metropolis, 2025).
The primary factor limiting its overall ranking is cost. Copenhagen is the second most expensive city in the top ten, behind only Singapore, and its ease-of-settling-in score is among the lowest in the sample. These factors moderate the composite score despite otherwise strong performance. For residents able to accommodate these costs, Copenhagen provides a highly consistent and well-functioning living environment, supported by strong public infrastructure and institutional stability.
10/ Seoul, South Korea

Seoul ranks tenth in the index and stands out for its exceptional performance in healthcare, where it records the highest score in the index, contributing substantially to its overall position and reinforcing its reputation for high-quality medical services. Seoul’s healthcare strength is reflected in South Korea’s medical tourism scale: the country received 2.01 million foreign medical visitors in 2025, highlighting its international reputation for medical services (The Korea Herald, 2026).
The city also performs strongly on safety, placing it among the higher-ranking cities on this indicator, while maintaining a cost of living that is moderate relative to several other top ten destinations. This combination supports a favorable balance between quality and affordability.
The principal constraints are environmental and social. Air quality is weaker relative to other cities in the top ten, and English proficiency together with ease of settling in suggest that integration may require additional time and adjustment for international residents. Despite these considerations, Seoul offers a strong overall profile, particularly for residents prioritizing healthcare and value relative to cost.
The findings of this index point to a livability landscape that resists simple ranking. No city in the sample leads on every dimension, and the cities that do lead the composite – Lisbon, Amsterdam, Melbourne, Vienna – share a common characteristic that has little to do with excellence in any single area: they are cities without a significant weakness. This is the most consistent finding across the 35 cities assessed. Livability, as measured here, is a function of balance rather than peak performance.
The three paradoxes identified in the data reinforce this conclusion. Affordability, ease of settling in, and single-indicator excellence each offer important advantages, but none reliably translates into overall livability. Together, these patterns suggest that the question facing prospective expats is not which city is objectively best, but which combination of strengths and trade-offs best aligns with their priorities.
Regional patterns extend this argument by showing that each region offers a distinct form of livability. Europe stands out for structural and institutional strength, particularly in healthcare, mobility, infrastructure, and environmental quality. Latin America offers a strong lifestyle-oriented profile, supported by affordability and ease of social integration. Asia combines strong safety outcomes with balanced performance across most other dimensions, making it a competitive region for relocators seeking stability and urban efficiency.
For internationally mobile individuals making relocation decisions, the relevant comparison is rarely city against city in the abstract. It is a profile against priority. A digital nomad with location-independent income may prioritize affordability and expat community, in which case Bangkok, Tbilisi, and Bali become genuine candidates regardless of where each is in the composite. A retiree may prioritize healthcare quality and safety, narrowing the field to Vienna, Tokyo, Seoul, or Copenhagen. A family relocating with children may weight English-language access and institutional stability, considering Melbourne, Auckland, Amsterdam, or Singapore. A high-net-worth individual may prioritize mobility, personal security, and access to residence-by-investment pathways, bringing Lisbon, Singapore, Zurich, and Dubai into focus. Some cities, notably Lisbon and Barcelona, are comfortably across more than one of these profiles, combining moderate costs with strong healthcare, high social accessibility, and dedicated visa pathways for retirees, remote workers, and investors alike, which is part of why they are consistently visible in voluntary relocation flows.
The central contribution of this index is that it shifts livability from a city-performance question to a relocation-fit question. By integrating mobility rights and expat experience alongside conventional urban indicators, it captures not only where life is objectively comfortable, but where international residents are most likely to settle and sustain a long-term lifestyle.
Thus, this allows readers to see which cities perform consistently well across the chosen indicators, and which align most closely with their own priorities, whether those center on cost, healthcare, mobility, or social ease. In an increasingly heterogeneous global mobility landscape, this kind of structured comparison is what turns a long list of options into an informed choice.
References
- United Nations Department of Economic and Social Affairs (UN DESA). (2025). International migrant stock 2024: Key facts and figures (advance unedited version). https://www.developmentaid.org/api/frontend/cms/file/2025/07/undesa_pd_2025_intlmigstock_2024_key_facts_and_figures_advance-unedited.pdf
- Herrman, T., & Lewis, C. (2017). What is livability? Sustainable Cities Initiative. University of Oregon.
https://sci.uoregon.edu/sites/default/files/sub_1_-_what_is_livability_lit_review.pdf
- Kaal, H. (2011). A conceptual history of livability.
https://www.academia.edu/3742052/A_conceptual_history_of_livability
- Global Citizen Solutions. (2025). Global digital nomad report 2025.
https://www.globalcitizensolutions.com/report/global-digital-nomad-report-2025-full-report/
- Organisation for Economic Co-operation and Development (OECD). (2025). International migration outlook 2025.
https://www.oecd.org/en/publications/international-migration-outlook-2025_ae26c893-en.html
- Qonita, M., Rachmawati, R., & Rijanta, R. (2025). Assessing Amsterdam’s urban mobility through the lens of smart mobility goals. Case Studies on Transport Policy, 20, 101443. https://doi.org/10.1016/j.cstp.2025.101443
- Barcelona City Council. (2025). Barcelona data sheet 2025. Department of Statistics and Data Dissemination. https://bcnroc.ajuntament.barcelona.cat/jspui/bitstream/11703/143575/1/Data_sheet_2025_CAS-en-GB.pdf
- Skytrax. (2025). Singapore Changi Airport is named the World’s Best Airport in 2025. Skytrax Ratings. https://skytraxratings.com/singapore-changi-airport-is-named-the-worlds-best-airport-in-2025
- Tokyo Metropolitan Government. (2026). Foreign population by municipality and nationality/region: Top 10 countries and regions, as of January 1, 2026 [Table 1]. Statistics of Tokyo. https://www.toukei.metro.tokyo.lg.jp/gaikoku/2026/ga26010000.htm
- Commonwealth Fund. (2026). Japan: International health care system profiles. https://www.commonwealthfund.org/international-health-policy-center/countries/japan
- Metropolis. (2025). Cycling in Copenhagen. use: urban sustainability exchange. https://use.metropolis.org/case-studies/cycling-in-copenhagen