At Global Citizen Solutions, we work closely with internationally mobile investors, entrepreneurs, and families who are increasingly thinking beyond short-term returns. They are asking deeper questions about jurisdictional stability, regulatory predictability, innovation capacity, and long-term resilience. The Global Atlas of Risk and Readiness (GARR) was developed with that mindset.
This report brings together structural risk indicators and forward-looking readiness measures to provide a clearer picture of national competitiveness. It highlights countries that combine institutional strength, innovation ecosystems, energy resilience, and economic depth, characteristics that increasingly influence investment confidence and capital allocation decisions.
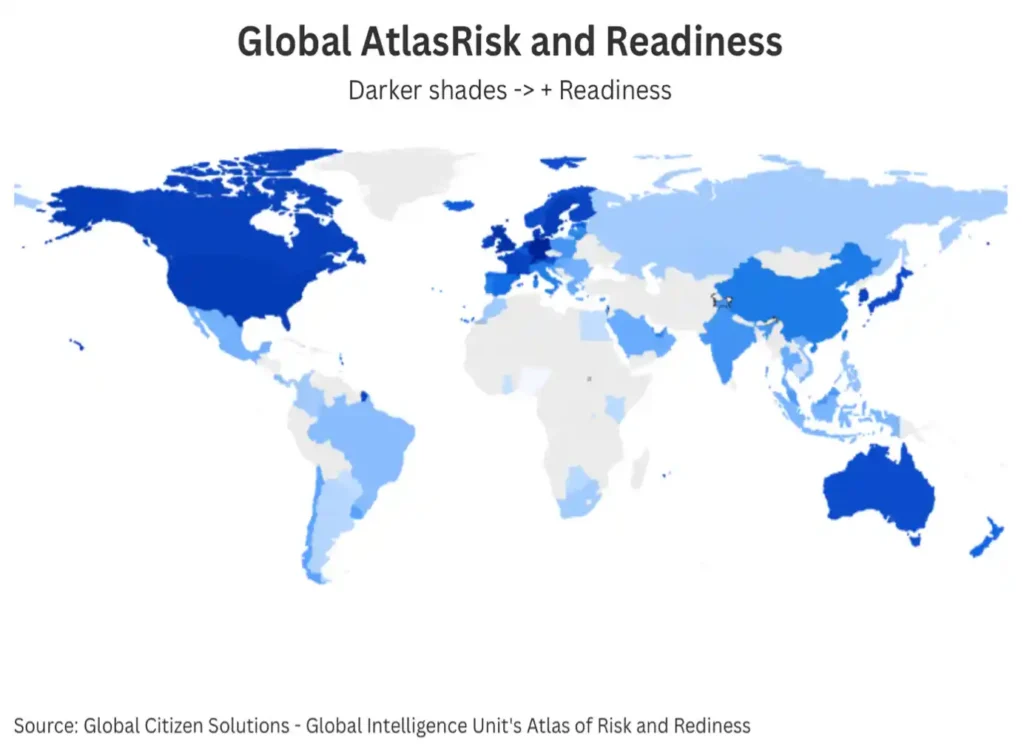
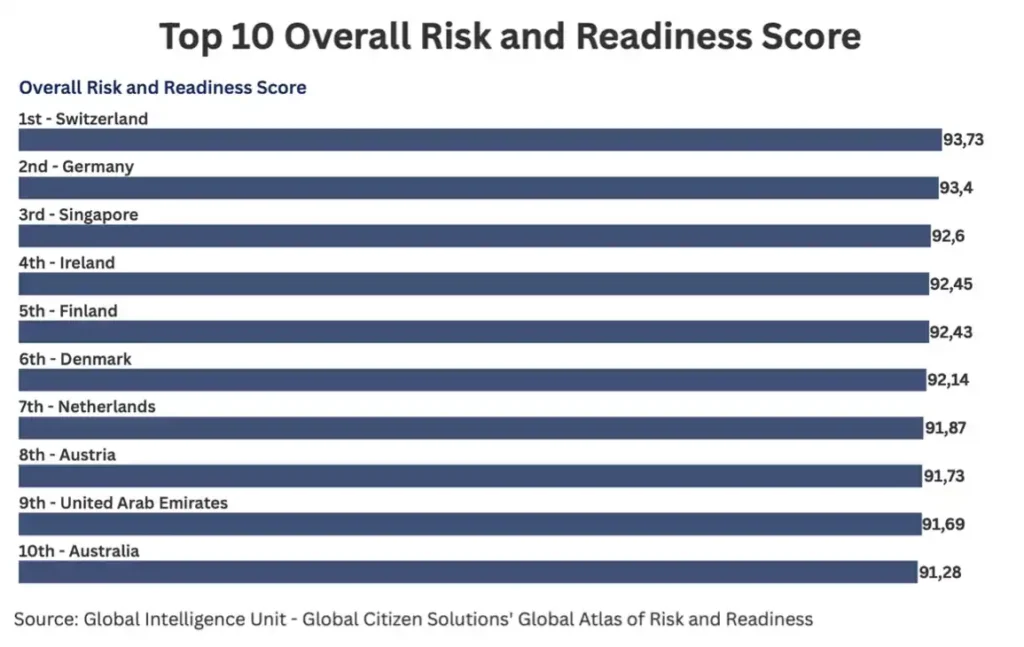
In this year’s edition, Switzerland, Germany and Singapore stand out for their ability to balance stability with advanced readiness. A strong group including Ireland, Denmark, Finland, the Netherlands, Canada, and Australia continues to demonstrate that resilient governance and innovation-led growth remain powerful attractors of capital.
No model eliminates uncertainty. However, in a more fragmented and unstable global landscape, disciplined evaluation of structural conditions becomes a competitive advantage.
Our aim is to provide investors with a practical, transparent framework to assess where risk is manageable, where readiness is credible, and where long-term value creation is most likely to endure.
We hope the GARR supports more informed, strategic decisions in a world where resilience has become one of the most valuable assets of all.
Patricia Casaburi
CEO, Global Citizen Solutions
Global Atlas of Risk and Readiness 2026
The 2026 edition of the Global Atlas of Risk and Readiness addresses a central question for investors: where is capital most likely to remain protected while compounding over the long term?
In a global environment shaped by geopolitical fragmentation, supply-chain realignment, energy transition pressures, and rapid technological change, traditional growth indicators are no longer sufficient. Investors are increasingly evaluating countries through a dual lens: structural risk and systemic readiness. This report integrates both into a single comparative framework.
A World of Selective Opportunity
The investment landscape is becoming more selective. While growth remains uneven, volatility is increasingly structural rather than cyclical. Public debt, geopolitical tensions, regulatory uncertainty, and climate exposure are reshaping capital allocation.
At the same time, a smaller group of countries demonstrates strong institutional capacity, digital maturity, innovation, and energy resilience. Now key differentiators for institutional investors and globally mobile HNWIs.
2026 Leaders in Risk-Adjusted Readiness
Top performers combine strong governance, advanced innovation systems, deep capital markets, and credible resilience infrastructure.
The Netherlands, Sweden, Canada, and Australia complete a consistent upper tier of resilient, innovation-led economies.
These countries share common characteristics:
- Strong rule of law and regulatory reliability
- Advanced digital and AI readiness
- High human capital depth
- Energy system resilience
- Liquid and sophisticated financial markets
Their strength lies not in the absence of risk, but in their capacity to manage it.
The Risk–Readiness Divide
The data highlights a widening divergence between:
- Economies that are institutionally stable and innovation-driven
- Economies facing higher structural risk, inflationary pressure, or governance constraints
While several emerging markets demonstrate strong growth momentum and market size advantages, higher geopolitical exposure, regulatory volatility, or macroeconomic imbalances may increase capital sensitivity.
For investors, this does not imply exclusion, but it does reinforce the importance of calibrated exposure and diversification.
What This Means for Investors
Three structural insights emerge from this year’s results:
- Readiness drives performance: Long-term success depends on institutional strength and adaptability, not low risk alone.
- Diversification should be strategic: Combine stable, mid-risk, and high-risk markets, each serving a distinct role in portfolios.
- Think in ecosystems, not just markets: Global hubs and innovation clusters offer broader access to capital, talent, and opportunities.
- Risk quality matters: Different types of risk require different strategies, understanding them improves decision-making.
- Policy and capability shape competitiveness: Strong institutions, digital capacity, and energy resilience are key to attracting and retaining investment.
A Strategic Tool for Capital Allocation
The Global Atlas of Risk and Readiness is not a prediction model, nor a substitute for jurisdiction-specific due diligence. Rather, it is a structured benchmarking instrument designed to:
- Support cross-border investment decisions
- Inform jurisdictional diversification strategies
- Provide policymakers with comparative positioning insights
- Help globally mobile investors assess long-term systemic stability
Over the past three decades, globalization fostered an increasingly interconnected economic system characterized by expanding trade integration, rising cross-border investment flows, and rapid technological diffusion. During much of this period, competitiveness was primarily assessed through conventional macroeconomic indicators such as GDP growth, export performance, labor costs, and market size. These metrics reflected a global environment in which capital mobility and trade liberalization were broadly expanding, allowing investors to evaluate jurisdictions largely on growth potential and market access.
In recent years, however, the international economic environment has undergone a profound transformation. Since the early 2020s, the convergence of geopolitical, technological, and environmental pressures has reshaped the foundations of the global economy. Russia’s invasion of Ukraine in 2022, renewed trade tensions, and intensifying strategic competition among major powers have accelerated the restructuring of supply chains and production networks. At the same time, commodity volatility, energy security concerns, and the increasing frequency of climate-related disruptions have introduced new layers of systemic risk that directly affect investment decisions.
Developments in 2025 and 2026 have further reinforced this shift. Governments across major economies have expanded industrial policies, strengthened controls over strategic technologies, and introduced new regulatory frameworks for artificial intelligence, cybersecurity, and digital infrastructure. These changes are occurring alongside rising public debt, demographic pressures in advanced economies, and the growing importance of critical minerals and energy resources. As a result, investors increasingly operate in an environment where geopolitical risk, technological sovereignty, and environmental resilience are central to long-term economic stability.
The Global Atlas of Risk and Readiness (GARR) responds to this shift by integrating structural stability and forward-looking capacity into a unified framework for evaluating national competitiveness. Its central premise is that long-term investment attractiveness depends on the interaction between two dimensions: the ability to manage systemic risks, such as fiscal fragility, geopolitical exposure, and institutional weakness, and the capacity to generate future opportunities through innovation, technological leadership, and economic diversification.
Countries that successfully combine these dimensions are more likely to provide resilient environments for capital, talent, and sustained value creation in an increasingly uncertain global landscape.
A Strategic Framework for Evaluating National Resilience and Competitiveness
The Global Atlas of Risk and Readiness (GARR) is a comparative framework designed to assess structural competitiveness and long-term resilience across national economies. Unlike traditional rankings focused on short-term growth or economic size, the GARR integrates indicators capturing both systemic risk exposure and forward-looking readiness.
The core premise is that sustainable competitiveness depends on a country’s ability to limit structural vulnerabilities while maintaining the institutional, technological, and economic capacity to generate future growth. Countries performing strongly across both dimensions are more likely to provide stable environments for capital allocation, long-term investment, and wealth preservation.
From Traditional Country Risk to Structural Competitiveness
Country risk has evolved from a narrow concern of sovereign lenders into a central framework for understanding global capital allocation. Historically associated with default risk, exchange controls, and expropriation (North, 1990), it now encompasses a multidimensional assessment of whether a country can maintain macroeconomic stability, institutional predictability, and resilience to geopolitical, technological, and climate shocks (World Economic Forum, 2025).
This broader perspective is particularly relevant for investors evaluating not only returns, but their durability under stress. The GARR framework reflects this shift by treating country risk as a structural condition shaping long-term investability, rather than a short-term crisis variable.
This approach is grounded in institutional economics. North (1990) demonstrated that institutions reduce uncertainty, shape incentives, and lower transaction costs, arguing that long-term economic performance depends not only on resources or technology, but on the rules and enforcement structures governing economic activity.


Disclaimer
The Global Atlas of Risk and Readiness (GARR) is an analytical framework developed for comparative research purposes. The index is based on publicly available data sources and methodological assumptions designed to enable cross-country comparison of selected structural indicators. While reasonable efforts have been made to ensure the accuracy and consistency of the data and methodology, no guarantee is made regarding the completeness, reliability, or timeliness of the information presented.
The results should be interpreted as indicative analytical estimates rather than definitive assessments of economic performance, country risk, or investment conditions. The index does not constitute financial, investment, legal, or policy advice, and it should not be used as the sole basis for decision-making. Users of the index are encouraged to consult additional sources and professional advice when evaluating economic conditions, policy environments, or investment opportunities.
Neither the authors nor the publishing institution assume responsibility for any decisions made or actions taken based on the information contained in this report.