
Country risk has evolved from a narrow concern of sovereign lenders into a central framework for understanding global capital allocation. Historically associated with default risk, exchange controls, and expropriation (North, 1990), it now encompasses a multidimensional assessment of whether a country can maintain macroeconomic stability, institutional predictability, and resilience to geopolitical, technological, and climate shocks (World Economic Forum, 2025).
This broader perspective is particularly relevant for investors evaluating not only returns, but their durability under stress. The GARR framework reflects this shift by treating country risk as a structural condition shaping long-term investability, rather than a short-term crisis variable.
This approach is grounded in institutional economics. North (1990) demonstrated that institutions reduce uncertainty, shape incentives, and lower transaction costs, arguing that long-term economic performance depends not only on resources or technology, but on the rules and enforcement structures governing economic activity.
Part I – The Risk Pillar
Institutional Foundations of Country Risk
For a country-risk framework, this literature is foundational because it explains why the same macro shock can produce different outcomes depending on institutional quality. Countries with stronger legal systems, more credible state capacity, and more predictable regulatory environments are usually better able to manage crises without destroying investment confidence.
This institutional perspective is also central to recent work by major international organizations. The World Bank’s Worldwide Governance Indicators (2025) continue to treat rule of law, regulatory quality, and control of corruption as distinct but related elements of state effectiveness . The OECD’s 2025 Regulatory Policy Outlook similarly argues that in a world of rapid technological, environmental, and geopolitical change, regulatory quality is no longer a procedural issue alone; it is part of economic adaptability and strategic competitiveness. The implication for country-risk analysis is that governance indicators should not be treated as background variables. They are among the most direct measures of whether a country can make credible commitments to investors, enforce contracts consistently, and adjust policy without causing destabilizing uncertainty.
Macroeconomic Stability and Fiscal Sustainability
Macroeconomic credibility remains a foundational component of country risk. Inflation volatility, fiscal imbalances, debt sustainability, and external pressures directly affect investment conditions. Fischer (1993) established that inflation, large deficits, and exchange-rate distortions are negatively associated with growth. Subsequent literature confirms that persistent inflation reduces planning horizons, raises discount rates, and weakens price signals (Summers, 2006).
Public debt adds an additional layer of vulnerability. Reinhart and Rogoff (2008) show that debt crises are recurrent features of financial history, often linked to cycles of leverage and policy failure. The BIS (2025) further highlights that elevated public and private debt levels, combined with weaker productivity and tighter financial conditions, increase systemic risk. Debt matters not only as a stock of obligations, but because it constrains fiscal space and limits crisis response capacity. This justifies including both debt levels and fiscal space as complementary indicators.
External vulnerability is equally critical. Current-account imbalances and reliance on external financing increase exposure to sudden stops and shifts in global risk appetite (World Bank; BIS, 2024). The composition of financing also matters, as local-currency markets may improve resilience but do not eliminate exposure to global shocks.
Financial market depth further influences resilience. Liquid capital markets improve shock absorption, reduce reliance on volatile funding, and enhance policy transmission (BIS, 2024). In this context, market liquidity is a structural component of country risk.
Political and Regulatory Risk
Institutional and regulatory risk form the next major block of literature. Busse and Hefeker’s (2007, pp. 414-5) study of political risk, institutions, and FDI remains important because it finds that government stability, conflict, corruption, law and order, and bureaucratic quality materially affect foreign investment decisions. More recent OECD (2025) work on FDI regulatory restrictiveness makes the same point from a policy perspective: statutory barriers, screening rules, and discriminatory restrictions can weaken a country’s attractiveness to foreign investors even when macro conditions are otherwise sound. Together these literatures support the use of regulatory uncertainty, rule of law, and related governance variables as country-risk measures. Investors do not price formal laws alone; they price how predictable, contestable, and enforceable the regulatory environment actually is.
This governance literature also justifies the inclusion of corruption risk as a critical component of country risk analysis. The World Bank’s governance indicators capture state capability and legal reliability through measures such as rule of law, regulatory quality, and control of corruption.
As a result, governance quality becomes a central determinant of investment confidence. Countries with stronger legal institutions and lower corruption levels tend to provide more predictable environments for business activity, encouraging entrepreneurship, foreign direct investment, and long-term capital allocation.
Geopolitical Risk and Global Fragmentation
Geopolitical risk has moved sharply upward in importance in both academic and policy literatures. Caldara and Iacoviello’s Geopolitical Risk Index (2022) provided one of the most influential empirical tools for measuring the intensity of geopolitical tensions through news coverage of adverse events and risks. Their work shows that spikes in geopolitical risk are associated with lower investment and weaker economic activity.
More recently, the IMF (2023. Pp. 92-4) has connected these dynamics directly to foreign direct investment, arguing that geoeconomic fragmentation is reshaping the geography of FDI, with flows increasingly concentrating among geopolitically aligned economies, especially in strategic sectors. In practice, this means investors are now pricing not only domestic country conditions but also the degree to which a country sits inside or outside trusted geopolitical networks.
In the context of complex interdependencies, Rajkovic (2022) argues that contemporary geopolitical power increasingly operates through transnational legal, financial, and technological networks rather than purely territorial control, meaning that exposure to geopolitical risk depends not only on a country’s geographic location but also on its position within global production systems, financial infrastructures, and regulatory alliances. In this sense, risk is increasingly mediated by network membership (such as participation in trade blocs, financial systems, digital infrastructures, or supply chains) rather than by territory alone.
The Institute for Economics & Peace’s 2025 Global Peace Index reports a continuing deterioration in global peacefulness and frames the present moment as one of deepening fragmentation. The World Bank’s January 2025 Global Economic Prospects adds that trade restrictions remain far above pre-2020 norms and that heightened geopolitical tensions are one reason trade growth is expected to remain below the 2010–19 average in many economies. For country-risk analysis geopolitical exposure is now part of baseline scenario to take into consideration.
That is why the GARR’s use of a geopolitical tension exposure indicator is well supported by the literature. A country’s peacefulness, conflict exposure, militarization, and regional-security context affect trade reliability, insurance costs, energy pricing, tourism, migration, and the long-term viability of fixed investment.
Climate and Environmental Risk
Climate and environmental risk now occupy a similarly central place in country-risk assessment. Earlier literature often treated environmental issues as sector-specific or long horizon, but that is no longer tenable.
Burke, Hsiang, and Miguel’s work on the nonlinear effects of temperature on economic production showed that climate shocks can have measurable growth effects, especially in warmer and more climate-vulnerable countries (2015). The ND-GAIN Country Index translates that broader research agenda into a country-comparison framework by summarizing both vulnerability to climate change and readiness to improve resilience.
The rise of climate risk in investment practice also has a capital-allocation dimension. Climate vulnerability influences where firms place production, how insurers price risk, and how lenders evaluate long-dated assets. The World Economic Forum continues to rank environmental risks among the most severe over longer time horizons, while the World Bank’s 2025 outlook explicitly includes climate-related natural disasters among the major downside risks to growth.
In sum, a country heavily exposed to climate shocks but weak in adaptation capacity may experience more frequent output losses, fiscal strain, and infrastructure damage, all of which feed into investability.
Demographic Pressures and Structural Risk
Demography is another structural variable that has returned to prominence. Ageing populations, lower fertility, and higher dependency ratios matter because they affect labor supply, pension burdens, healthcare costs, and the long-run tax base. BIS analysis in 2025 explicitly notes that ageing populations and labor shortages can reduce supply flexibility and leave economies more prone to inflationary pressure in a fragmented world. This makes demographic structure a risk variable, not only a social one.
At the same time, demographics alone do not determine performance. Their economic effect depends heavily on human capital. The World Bank’s Human Capital Index is useful here because it measures the expected productivity of a child born today given prevailing conditions in health and education. This links demographic composition to capability rather than headcount alone. In country-risk terms, human capital matters for two reasons: it raises adaptive capacity during shocks, and it supports higher-value economic activity over time.
A country with favorable demographics but weak skills and health outcomes may still underperform; a country with aging demographics but strong human capital may retain high productivity and innovation capacity. This is why GARR separates demography into the risk pillar and human capital strength into the readiness pillar.
Part II – The Readiness Pillar
While the Risk pillar captures structural vulnerabilities, the Readiness pillar evaluates the capacity of economies to generate sustained growth, adapt to structural change, and capture emerging opportunities. Readiness reflects the extent to which institutional, productive, and technological foundations support long-term competitiveness.
Economic Complexity and Market Opportunity
A central concept in this literature is economic complexity (Hidalgo & Hausmann, 2009). Harvard’s Atlas of Economic Complexity operationalizes the idea that what countries produce and export reveals information about their embedded knowledge, productive capabilities, and diversification potential. Complex economies tend to grow faster over the medium term because they possess denser networks of productive capabilities and a wider set of adjacent industries into which they can diversify.
At the same time, growth itself remains a relevant signal of economic opportunity. However, the literature increasingly warns against interpreting raw GDP growth as a sufficient indicator of long-term competitiveness (Rodrik, 2013; World Bank, 2025; OECD, 2025). The World Bank’s GDP growth data remain indispensable for assessing market dynamism, yet recent World Bank and OECD outlooks highlight the importance of interpreting growth alongside structural risks and institutional conditions.
The World Bank Global Economic Prospects (January, 2025), for example, expects global growth to remain subdued and identifies policy uncertainty, geopolitical tensions, persistent inflation, and climate shocks as significant downside risks. Similarly, the OECD’s Economic Outlook 2025 emphasizes that trade tensions, fiscal sustainability, and regulatory credibility are now central to the investment environment.
Within the GARR framework, GDP growth therefore belongs in the readiness pillar not as a stand-alone measure of competitiveness but as one component of a broader assessment of market opportunity.
Innovation Capacity and Technological Competitiveness
Innovation capacity is a core driver of readiness, reflecting an economy’s ability to generate new value and sustain productivity growth. Strong innovation systems enable economies to move beyond factor-based growth toward knowledge-driven competitiveness.
Innovation indicators capture not only current output, but also the institutional, financial, and ecosystem conditions supporting technological development. Economies with stronger innovation capacity are better positioned to adapt to shocks, restructure production, and compete in high-value sectors.
Digital readiness complements this by assessing the ability to deploy technologies across the economy. The IMF emphasizes that digital transformation is increasingly central to productivity, resilience, and economic organization.
Digital readiness, in the GARR, is treated as a measure of adaptive capacity: economies with stronger digital ecosystems can integrate emerging technologies, support entrepreneurship, and enhance public service delivery more effectively.
Energy Systems and Structural Economic Resilience
Energy resilience has become a core dimension of competitiveness. The World Energy Council’s Trilemma framework highlights the importance of balancing energy security, sustainability, and equity, while recent IEA analysis emphasizes the continued centrality of energy security in a fragmented global system.
Energy systems affect industrial costs, inflation dynamics, supply reliability, and strategic autonomy. Countries with more diversified, reliable, and sustainable energy systems are better positioned to maintain competitiveness during periods of disruption and transition.
Energy resilience is therefore treated as a structural determinant of both stability and growth capacity in the GARR metrics.
Policy Implications: Strategic Positioning in a Fragmented World
Recent evidence on foreign direct investment (FDI) reinforces the importance of combining risk and readiness. UNCTAD (2024, 2025) reports declining global investment flows and increasing concentration in digitally advanced and geopolitically aligned economies. Similarly, IMF research shows that strategic sectors are increasingly shaped by geopolitical alignment.
These trends indicate that capital is becoming more selective, favoring jurisdictions that combine institutional credibility, technological capability, and policy stability. This dynamic underpins the GARR framework.
The literature supports a composite, two-pillar approach. On the risk side, key variables include macroeconomic stability, governance quality, geopolitical exposure, and external vulnerability. On the readiness side, core drivers include innovation, digital capacity, human capital, economic complexity, and energy resilience.
No single indicator captures competitiveness in isolation. Instead, resilience emerges from the interaction between risk management and adaptive capacity. The GARR framework captures this interaction by evaluating whether countries can simultaneously manage downside risks and sustain long-term opportunity.
From a policy perspective, this implies that competitiveness is increasingly defined by strategic positioning. Countries compete not only on cost or scale, but on institutional strength, regulatory predictability, technological capability, and energy security.
The global economy is entering a phase in which predictability itself has become scarce. The assumptions that once underpinned cross-border investment, stable trade expansion, deepening financial integration, and relatively frictionless supply chains, no longer operate with the same reliability. Instead, investors face a landscape defined less by cycles and more by structural shifts.
Recent projections from major international institutions reflect this transition. The World Bank (2025c, pp. 6-10) anticipates moderate global growth constrained by geopolitical tensions, trade disruptions (tariffs and supply chains’ complex interaction), and environmental shocks, while the OECD (2025a, pp. 15-25)) highlights heightened policy uncertainty, rising trade barriers, and tighter financial conditions.
One of the most significant shifts concerns the role of geopolitics in shaping economic outcomes. Geopolitical risk, once treated as an episodic disruption, has become a structural feature of the global system. The deterioration in global peacefulness (Institute for Economics & Peace, 2025, pp. 2–5), together with the World Economic Forum’s identification of state-based armed conflict as a leading short-term risk (World Economic Forum, 2025, pp. 4–7), highlights the increasing centrality of geopolitical tensions in shaping the global risk landscape. The European response to the war in Ukraine offers a clear example: the rapid reduction in dependence on Russian energy has required large-scale adjustments in infrastructure, energy sourcing, and industrial policy. Such shifts demonstrate how geopolitical shocks are increasingly translated into long-term structural change.
At the same time, geopolitical dynamics are reshaping the geography of production. As firms seek to reduce exposure to strategic vulnerabilities, supply chains are being reconfigured toward more diversified and, in many cases, geographically proximate networks. This process, often described as geoeconomic fragmentation, has led to a growing concentration of investment among politically aligned economies. Countries such as Mexico and Vietnam have benefited from this reorientation, attracting manufacturing activity and foreign direct investment as firms pursue greater resilience through diversification.
Parallel to these developments, technological transformation is redefining the sources of competitiveness. Advances in artificial intelligence, digital infrastructure, and data-driven industries are creating new forms of economic value while widening the gap between countries that can develop and deploy these technologies and those that primarily adopt them.
Although global growth continues to be supported in part by technological investment, as noted by the IMF (2025b, pp. 1-15, 60-80), the benefits are unevenly distributed. Economies with strong research ecosystems, skilled labor forces, and access to capital are consolidating their position as innovation leaders, while others face constraints in translating technological change into productivity gains. The contrast between the United States, with its deep innovation capacity, and smaller but strategically focused economies such as Singapore, illustrates how different models can achieve high levels of readiness when supported by coherent policy and institutional strength.
Energy systems have also re-emerged as a central determinant of economic stability and competitiveness. The International Energy Agency (2025, pp. 5-10, 25-40, 90-110) emphasizes that energy security is no longer a peripheral concern, but a core component of both economic and national security strategies. Disruptions in energy supply can rapidly propagate through economies, affecting inflation, industrial costs, and fiscal stability. The European transition away from Russian gas underscores how energy considerations can drive structural transformation, while the United Arab Emirates’ long-term investment in diversification and renewable capacity highlights a proactive approach to building resilience. In both cases, energy policy is closely linked to broader questions of economic adaptability and strategic positioning.
Despite these structural shifts, global investment flows remain fragile. UNCTAD (2025, pp.1-10, 20-30) reports a decline in FDI when volatile conduit flows are excluded, suggesting that uncertainty continues to weigh on long-term capital allocation. At the same time, investment is becoming more selective. Capital is increasingly directed toward jurisdictions that combine institutional reliability with innovation capacity and strategic relevance, as seen in economies such as Ireland and Singapore. Elsewhere, countries in Southeast Asia have gained importance as manufacturing and logistics hubs, while many African economies continue to face challenges in translating resource-based investment into broader structural development.
Climate risk further complicates this landscape by introducing an additional layer of uncertainty that affects both short-term stability and long-term growth prospects. Empirical evidence shows that climate-related shocks can have measurable economic impacts, particularly in regions with higher exposure and limited adaptive capacity (Burke, Hsiang, & Miguel, 2015, pp,236-9). The World Bank (2025a, pp. 1-8) identifies environmental risks as an increasingly significant source of volatility, affecting infrastructure, agricultural productivity, and fiscal outcomes. As a result, investors are placing greater weight on climate resilience and the ability of countries to manage environmental transition, recognizing that these factors are becoming integral to economic performance rather than external considerations.
Taken together, these developments point to a fundamental shift in how competitiveness is defined. Resilience is no longer a passive characteristic but an outcome shaped by policy choices. Economies that strengthen institutional credibility, invest in technological capacity, and develop robust energy and financial systems are better positioned to navigate uncertainty and sustain growth. Conversely, those that remain exposed to persistent structural risks without corresponding adaptive capacity are likely to face higher volatility and greater difficulty in attracting long-term investment.
In sum, rather than viewing risk as something to be avoided and growth as something to be maximized, investors increasingly assess how effectively countries manage the relationship between the two. The result is a more selective and differentiated global system, in which capital flows are guided not only by opportunity, but by the credibility of the structures that support it.
A New Framework for a Changing World
At the core of the GARR framework are two interdependent dimensions. The Risk sub-index reflects exposure to systemic vulnerabilities, including political instability, macroeconomic volatility, environmental pressures, and social fragility. These factors represent the external constraints that can disrupt economic stability and weaken investor confidence.
The Readiness sub-index captures the internal capacity of economies to navigate these pressures. It encompasses institutional quality, regulatory effectiveness, innovation capability, infrastructure, and human capital. While risk defines the intensity of potential shocks, readiness determines how effectively those shocks can be absorbed and managed.
Taken together, these dimensions shift the analytical focus from binary classifications of “safe” versus “risky” jurisdictions toward a spectrum of resilience. Countries are differentiated not by the absence of risk, but by their ability to balance exposure with adaptive capacity. This balance increasingly defines their position within the global system and their attractiveness for long-term capital allocation.
The Risk–Readiness Matrix: Distribution, Clustering, and Structural Asymmetry
The Global Risk–Readiness Matrix (chart below) provides a consolidated visual representation of how 85 jurisdictions position themselves across two defining dimensions of modern competitiveness: structural risk and adaptive readiness. The matrix reveals not only relative rankings, but also the underlying distribution, clustering patterns, and structural imbalances that shape the global investment landscape.
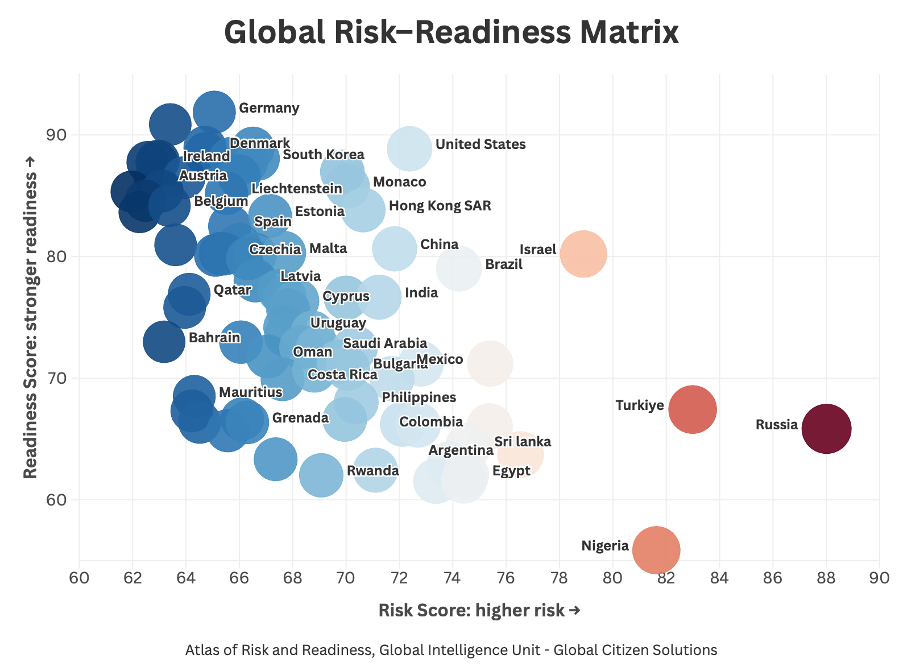
The matrix confirms that resilience is not evenly distributed. Instead, it is concentrated within a relatively narrow group of economies that combine low exposure to systemic risk with high levels of institutional, technological, and economic capacity. These countries occupy the upper-left quadrant of the chart and represent the most favorable risk-adjusted environments for capital allocation.
A clear clustering effect is visible in the upper-left region of the matrix, where a dense concentration of countries (including Germany, Ireland, Austria, Belgium, and other Western European economies) demonstrates both low risk scores (typically between 62 and 66) and high readiness levels (generally above 85). This cluster represents the structural core of global readiness.
Rather than a small number of outliers, the presence of a tightly packed cluster suggests that high performance across both dimensions is not accidental, but the result of shared structural characteristics. These include strong institutional frameworks, regulatory predictability, high human capital, and advanced infrastructure. The clustering also reflects regional spillover effects, particularly within Europe, where integration mechanisms reinforce governance standards and economic coordination.
Moving toward the center of the matrix, dispersion increases. Countries such as Czechia, Estonia, China, India, and Mexico are distributed across a broader range of readiness scores (approximately 65 to 82) and risk levels (roughly 66 to 74). This middle cluster is less dense and more heterogeneous, indicating that while these economies may share similar aggregate scores, their underlying structures differ significantly.
At the far right of the matrix, dispersion narrows again, but at lower levels of readiness. Countries such as Türkiye, Russia, Nigeria, and Argentina cluster within a relatively tight band of high risk (above 80) and low readiness (generally below 70). This suggests a convergence of structural constraints, where multiple risk factors (macroeconomic instability, governance challenges, and geopolitical exposure) reinforce each other.
Dispersion patterns further illustrate this dynamic. Among lower-risk economies, readiness levels vary widely, indicating that stability alone does not guarantee adaptability or growth potential. In contrast, high-risk environments tend to compress readiness within a lower range, suggesting that elevated vulnerability constrains the development of institutional and economic capacity. This reinforces the conclusion that while countries can achieve high readiness despite moderate risk, sustaining resilience under high-risk conditions remains significantly more challenging.
The matrix also highlights several important outliers that illustrate different models of competitiveness. The United States occupies a position of very high readiness (close to 90) but with a higher risk score than most European peers. This reflects the presence of structural strengths, innovation ecosystems, capital markets, and human capital, alongside rising political and fiscal pressures. It reinforces the idea that high income and technological leadership do not necessarily imply low risk.
The most important conclusion emerging from the matrix is that readiness is the decisive variable in global competitiveness. While risk remains a critical constraint, it is the capacity to adapt, innovate, and respond that ultimately determines a country’s position in the global system. This finding aligns with a growing body of economic literature emphasizing the role of institutions, human capital, and technological capability in shaping long-term performance (Acemoglu & Robinson, 2012; Hausmann et al., 2014; World Economic Forum, 2025). In practical terms, the matrix suggests that the future geography of capital will be defined not simply by where risks are lowest, but by where they are most effectively managed.
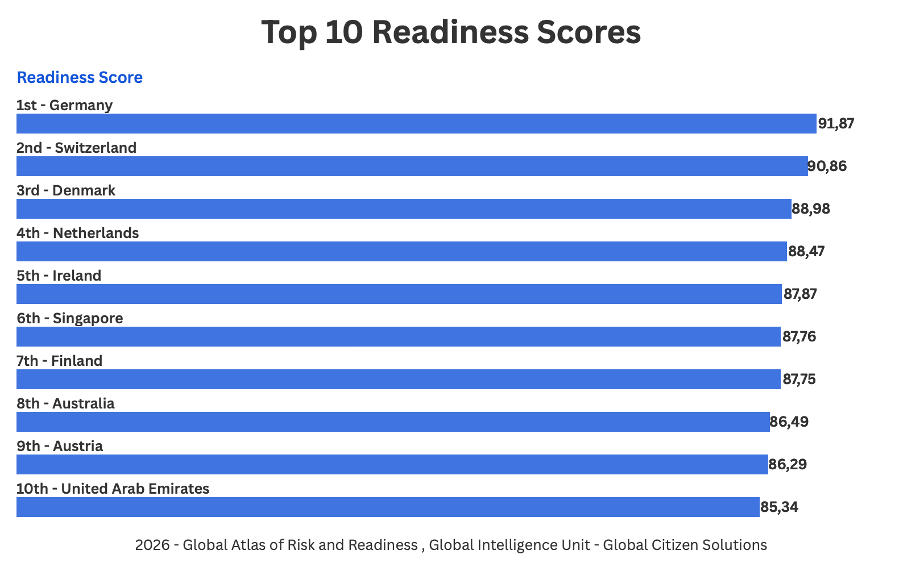
At the top of the rankings, convergence becomes evident. Switzerland leads with an overall score of 93.73, followed by Germany (93.40) and Singapore (92.60). The remaining top ten (including Ireland, Finland, Denmark, the Netherlands, Austria, the United Arab Emirates, and Australia) are tightly clustered between 91.28 and 92.45. This narrow spread of just over 2.4 points is analytically significant. It indicates that at the frontier of competitiveness, differences are incremental rather than structural, reflecting marginal advantages across governance, innovation, and macroeconomic stability.
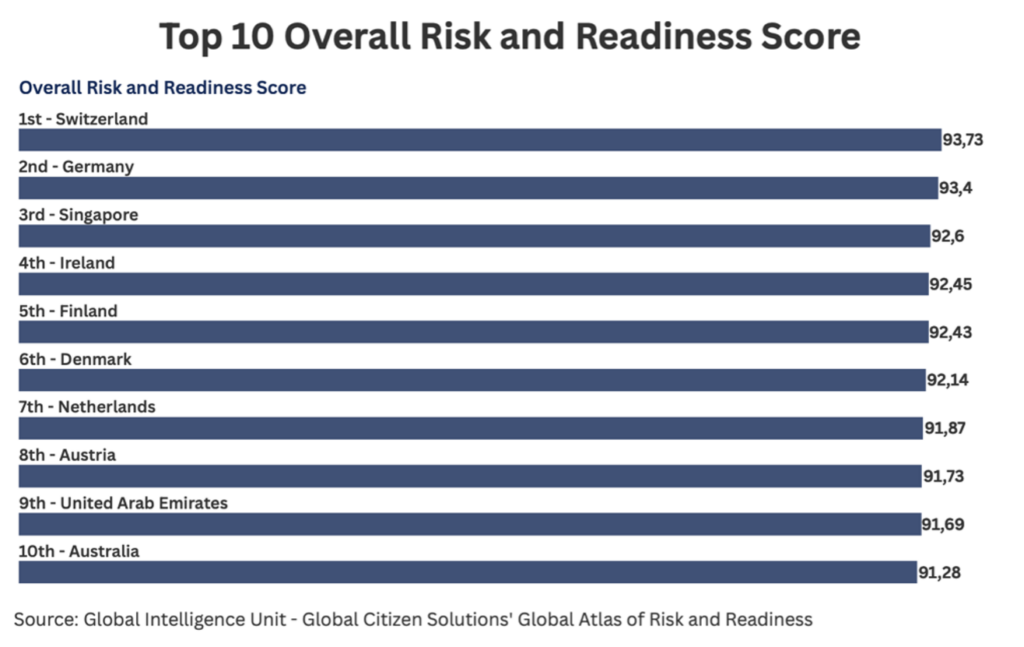
Switzerland’s position reflects a combination of institutional strength, financial sophistication, and innovation capacity. Germany, which leads the readiness ranking with a score of 91.87, exemplifies industrial resilience supported by economic diversification and human capital. Singapore, with one of the highest readiness levels globally and relatively low risk, demonstrates how strategic policy design and digital infrastructure can compensate for structural constraints (IMF, 2023).
Across this group, institutional quality remains the most consistent differentiator, reinforcing its central role in long-term resilience. At the same time, the inclusion of the United Arab Emirates, ranking 9th with a score of 91.69, highlights how targeted investment and diversification strategies can rapidly enhance readiness.
The convergence of readiness scores (generally between 85 and 92) contrasts with the wider dispersion observed in risk, confirming that high-performing economies align structurally around similar levels of adaptive capacity.
The heatmap of the top 10 economies (below) confirms that high performance in the GARR framework is not driven by a single factor, but by the consistent alignment of institutional strength, innovation capacity, and human capital. Across all leading countries, the most uniform and defining feature is the strength of the rule of law, which remains consistently high and reinforces the central role of governance in sustaining resilience (North, 1990; Acemoglu & Robinson, 2012, pp. 429-32).
At the same time, variation within this group reveals distinct strategic models. Switzerland achieves near-universal strength across indicators, particularly in innovation and economic complexity, reflecting a highly diversified and knowledge-intensive economy. Germany combines institutional quality with industrial depth and leads the readiness ranking. Singapore differentiates itself through exceptional digital readiness, AI capability, and human capital, illustrating a highly coordinated, state-led innovation model.
Nordic and Western European economies such as Denmark (88.98 readiness), Finland, and the Netherlands display more balanced profiles, with strong performance across governance, human capital, and external stability. This reinforces their position as structurally resilient economies, where no single pillar dominates but all contribute consistently to overall performance.
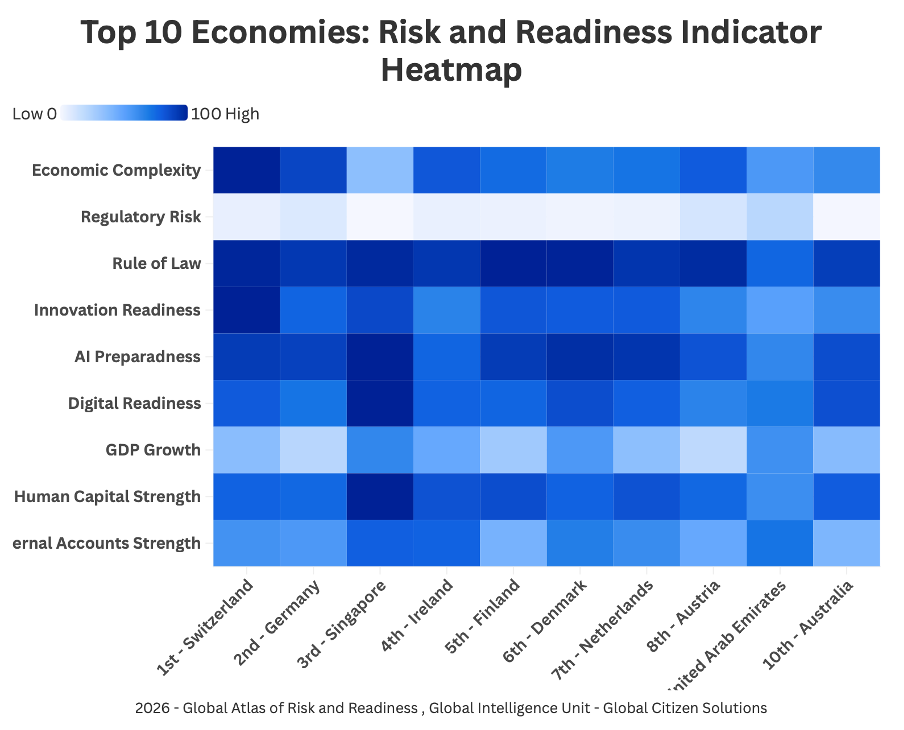
Despite this convergence, the heatmap shows that regulatory environments and policy frameworks still vary across countries, even within the top tier. GDP growth appears less decisive as a differentiating factor, with significantly lower variation compared to innovation or institutional indicators. This reinforces the idea that structural capacity, rather than short-term economic performance, defines long-term competitiveness.
Readiness scores among the top 10 remain tightly clustered, ranging from 91.87 (Germany) to 85.34 (United Arab Emirates), highlighting a strong convergence at the frontier of resilience. Differences in overall ranking are therefore driven more by marginal variations in risk exposure than by large gaps in structural capacity.
The inclusion of the United Arab Emirates (9th, 91.69 overall; 85.34 readiness) underscores the growing importance of alternative development models. While slightly below European peers in traditional institutional indicators, the UAE compensates through strong performance in infrastructure, digital readiness, and strategic investment, demonstrating how targeted policy can accelerate readiness.
The total range in readiness scores is approximately 6.5 points, which is broader than the overall ranking but significantly narrower than the risk distribution. This indicates that while readiness varies across countries, high-performing economies tend to converge around a similar level of structural capacity.
A key insight is the strong overlap between the readiness and overall rankings. Nearly all countries in the top 10 overall list also appear in the top 10 readiness ranking. This reinforces a central conclusion of the GARR framework:
readiness is the primary driver of overall competitiveness.
Germany’s position is particularly illustrative. While it does not rank first overall, it leads in readiness, suggesting that incremental differences in risk exposure can affect final rankings even among structurally strong economies. In contrast to the overall rankings, the Top 10 Risk Score chart reveals a very different distribution. Here, higher scores indicate greater exposure to structural risk, and the range is significantly wider.
Russia leads with a risk score of 88.01, followed by Türkiye (82.99) and Nigeria (81.63). The remaining countries (Israel, Argentina, Mexico, Colombia, Sri Lanka, Egypt, and Cambodia) fall within a band between 74.42 and 78.90.
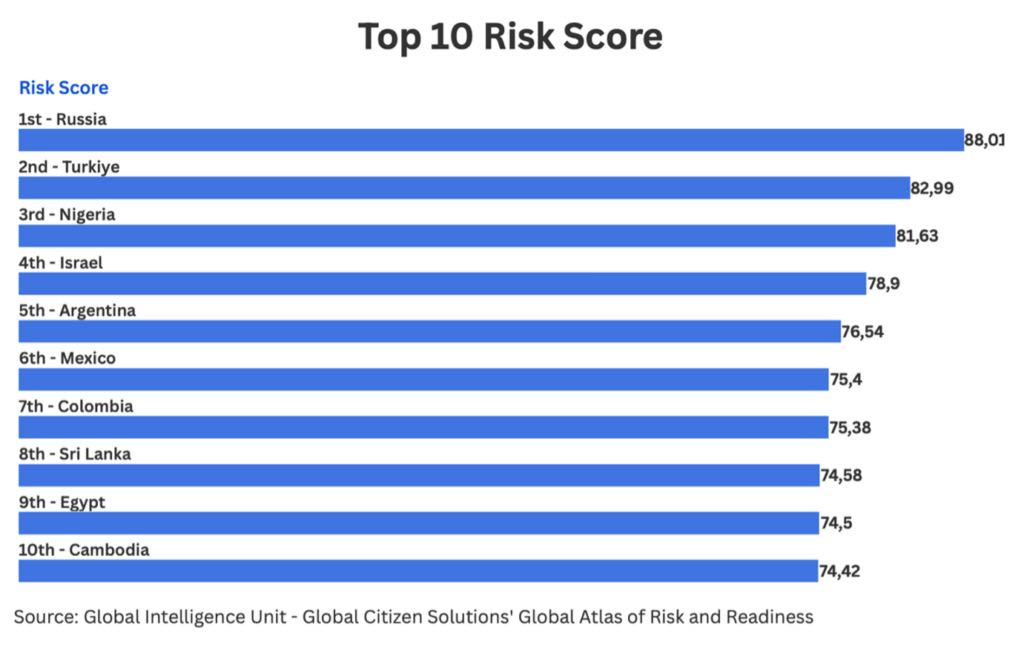
The spread between the highest and lowest values in this group is approximately 13.6 points, substantially larger than the range observed in the overall rankings. This indicates that risk is more unevenly distributed globally than resilience, with a clear stratification between highly exposed and moderately exposed economies.
Another important observation is that this group is regionally diverse but structurally similar. Despite differences in geography and economic size, these countries share common characteristics: elevated geopolitical exposure, macroeconomic volatility, regulatory uncertainty, or institutional constraints. This supports the broader literature suggesting that risk factors tend to be cumulative and mutually reinforcing (Reinhart & Rogoff, 2008. Pp. 5-10, 18-22; IMF, 2025b, 25-40).
When analyzed together, the three charts reveal several structural relationships. First, there is a clear asymmetry between risk and readiness. While high readiness strongly correlates with high overall performance, high risk does not necessarily imply low overall ranking. This is evident in cases such as Israel and, to a lesser extent, the United States (from the broader dataset), where strong innovation systems and institutional capacity offset elevated risk exposure.
Second, the absence of overlap between the top risk and top readiness groups is striking. None of the highest-risk countries appear among the top performers in readiness or overall rankings. This suggests that extreme levels of structural risk are difficult to compensate for, even with strong growth or market size advantages.
Third, the relatively narrow dispersion in overall scores compared to the wider dispersion in risk scores highlights an important dynamic: countries converge at the top through readiness, but diverge at the bottom through risk.
Beyond the top performers lies a more complex landscape. Countries such as Australia, Canada, Sweden, and France occupy a middle position, characterized by high readiness but moderate levels of risk.
These economies benefit from strong institutional frameworks and advanced infrastructure, yet they face emerging challenges. Political polarization, fiscal constraints, and environmental risks introduce uncertainties that affect their overall positioning. As the OECD (2025b, pp. 15-25) notes, even highly developed economies must continuously adapt to maintain resilience.
This group is particularly significant for investors. It represents a balance between stability and opportunity, where strong fundamentals coexist with manageable risks. For globally mobile individuals, these jurisdictions offer a combination of quality of life, economic opportunity, and relative security.
Countries at the lower end of the GARR rankings (such as Nigeria, Türkiye, Argentina, Cambodia, and Russia) are characterized by high structural risk and limited readiness, driven by macroeconomic volatility, institutional fragility, and regulatory uncertainty. These conditions typically reduce investment predictability and constrain long-term capital formation, as highlighted in the literature on institutions and economic performance (Rodrik, 2021, 135-45; World Bank, pp. 1-8, 40-60, 2025a).
However, these same constraints can generate higher return potential through elevated risk premia. In such environments, assets are often undervalued, creating opportunities for investors able to manage volatility and time market cycles effectively. Argentina illustrates this dynamic, where sovereign debt and energy assets have delivered significant gains during stabilization periods. Similarly, Türkiye’s currency depreciation has created entry points in export-oriented sectors, while Nigeria’s fintech and energy industries demonstrate how rapid growth and “leapfrogging” development can generate strong returns despite structural weaknesses (Partech Africa, 2023, pp. 5-15, 20-40; World Bank, 2024a, pp. 20-35).
High-risk markets are also characterized by sectoral divergence, where specific industries outperform even in unstable macro environments. Examples include energy in Russia, nearshoring-driven manufacturing in Mexico and Colombia, and early-stage industrial and tourism investment in Cambodia. In these contexts, returns are typically cyclical rather than linear, requiring tactical, timing-sensitive strategies rather than passive, long-term allocation (IMF, 2025b, pp. 25-55; BIS, 2025, pp. 30-50).
However, these opportunities are accompanied by significant constraints, including currency risk, regulatory unpredictability, and limited market liquidity. As a result, access to higher returns is uneven and depends on investor capabilities, including local knowledge, risk management, and sector expertise.
Overall, high-risk, low-readiness economies do not lack opportunity but offer a different investment profile. Rather than serving as core destinations for wealth preservation, they function as complementary allocations within diversified portfolios, providing exposure to growth, structural transformation, and market inefficiencies. This reinforces a central insight of the GARR framework: risk and return are structurally linked, and in volatile environments, opportunity exists, but only for those able to navigate complexity with discipline and precision.
The Global Atlas of Risk and Readiness map (below) provides a powerful visual synthesis of the shifting geography of global competitiveness. The distribution of darker shades (indicating higher readiness) reveals a clear concentration of structurally resilient economies across Western Europe, North America, and parts of Asia-Pacific. Countries such as Switzerland, Germany, the Netherlands, and the Nordic states form a dense cluster of high-readiness jurisdictions. Similarly, the United States, Canada, Australia, and Singapore stand out as non-European anchors of resilience, reinforcing the idea that readiness is closely associated with governance strength, technological capability, and economic sophistication.
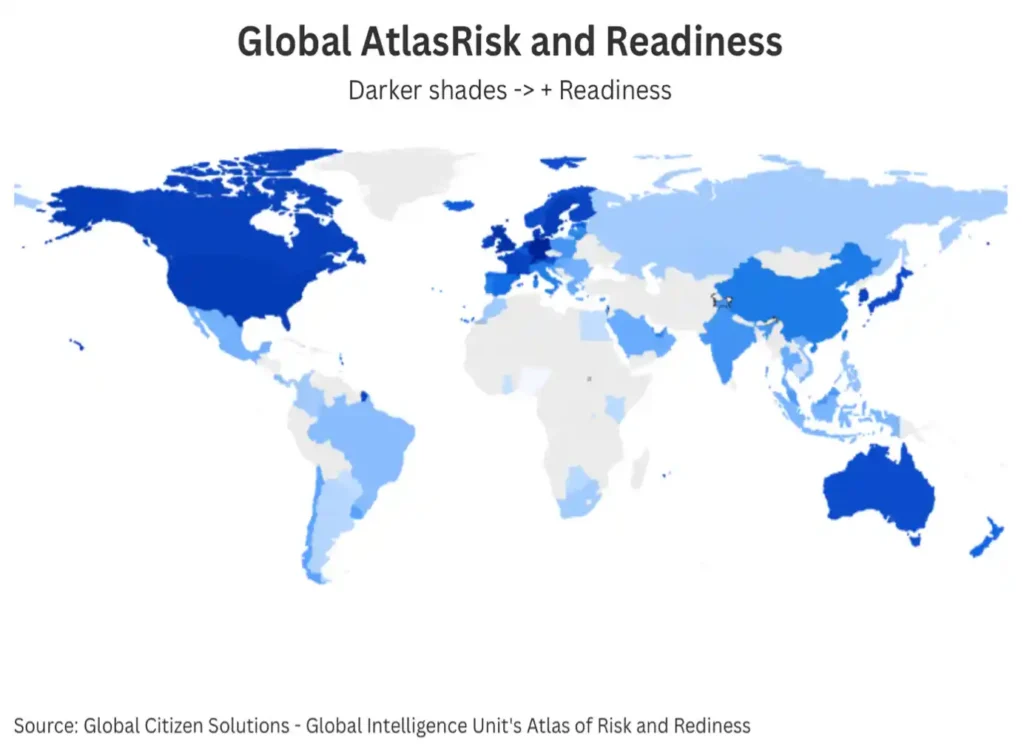
At the same time, the map highlights important nuances within advanced economies themselves. While North America and Western Europe appear uniformly strong, closer analysis reveals internal variation in risk profiles. The United States, for example, combines very high readiness with relatively higher structural risk compared to its European peers, reflecting internal sources of volatility such as fiscal imbalances and political polarization. In contrast, smaller European economies achieve comparable readiness with lower risk exposure, suggesting that institutional consistency and policy predictability play a critical role in shaping resilience. Beyond the core group of advanced economies, the map reveals a broad middle tier spanning much of Asia, parts of Eastern Europe, and segments of Latin America.
The map also clearly illustrates the challenges facing lower-readiness regions, particularly in parts of Africa, South Asia, and selected areas of Latin America. Lighter shades across these regions indicate limited institutional capacity, weaker infrastructure, and higher exposure to structural risks such as climate vulnerability and macroeconomic instability. This uneven distribution highlights a widening global divide, where some economies are strengthening their ability to convert growth into resilience, while others remain vulnerable to volatility and external disruption.
Taken together, the Global Atlas map captures a world that is no longer defined simply by levels of development, but by the ability to balance risk and readiness. The emerging pattern is one of regional divergence within an increasingly fragmented global system, where clusters of high-performing economies coexist alongside regions facing persistent structural challenges.
The distribution of overall GARR scores across regions reveals a global landscape defined not only by differences in average performance, but by distinct patterns of clustering and dispersion that reflect deeper structural realities. Europe stands out as the most tightly clustered region, with countries concentrated within a narrow high-performance range between approximately 91 and 94 points. In practical terms, resilience in Europe is not limited to a few leading economies but is broadly shared, reinforcing the region’s position as the most structurally cohesive and predictable investment environment.
Beyond this top tier, however, the chart reveals a sharp increase in dispersion. Asia-Pacific and North America display a much wider spread of scores, ranging from high-performing economies comparable to Europe to mid-tier countries with significantly lower readiness levels. This reflects what can be described as a dual-speed dynamic, where advanced economies coexist with structurally constrained ones within the same region. The presence of both high and mid-range performers indicates that the pathway to resilience is uneven, shaped by differences in governance, innovation capacity, and macroeconomic stability rather than geography alone.
A key insight emerging from this distribution is that convergence occurs primarily at the top, while divergence dominates below. Once countries reach a certain threshold of institutional strength and economic sophistication, their performance begins to converge, resulting in the tight clustering observed among leading economies. Below this threshold, however, countries follow more varied trajectories, producing wider dispersion. This creates a bifurcated global structure: a compact group of highly resilient economies and a broader, more heterogeneous set of countries with differing levels of preparedness and risk exposure.
Latin America and Africa illustrate a different form of clustering, characterized not by convergence at high performance levels, but by convergence under shared structural constraints. In both regions, most countries are grouped within a relatively narrow but lower score range, indicating common challenges related to institutional capacity, economic diversification, and infrastructure development. The limited upward dispersion suggests that while there are pockets of relative strength, these are not yet sufficient to shift the overall regional profile toward higher readiness.
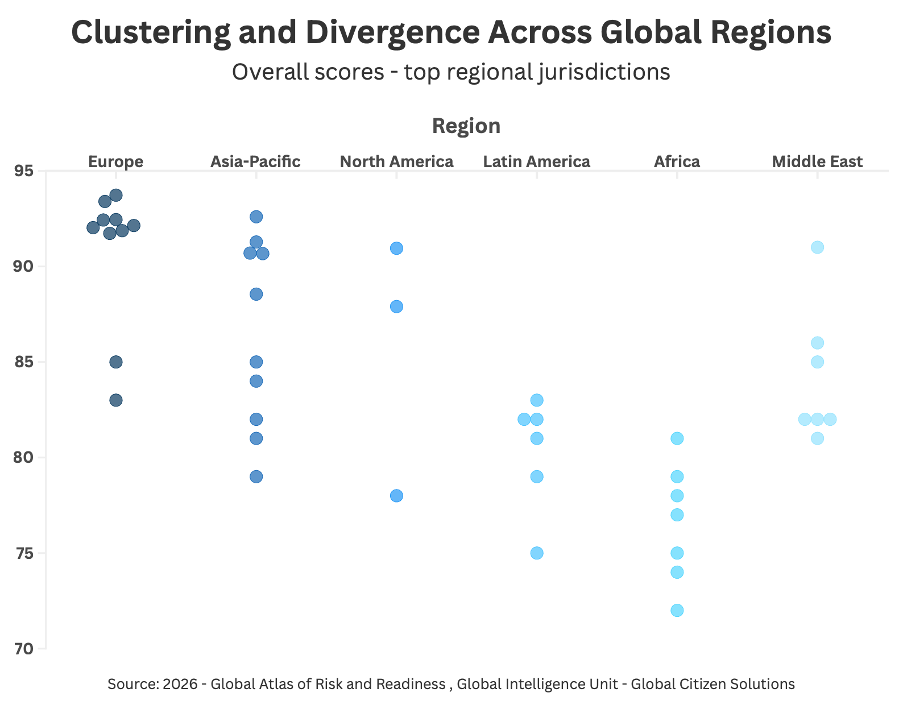
Finally, the chart highlights the importance of outliers and strategic hubs, which challenge regional averages and play a disproportionate role in shaping global competitiveness. Countries such as Singapore, the United Arab Emirates, and, to some extent, the United States act as structural outliers within their regions, achieving significantly higher readiness levels than their peers. These economies combine strong institutions, advanced infrastructure, and strategic positioning to function as global nodes of capital, innovation, and connectivity. Their presence underscores a critical point: global competitiveness is increasingly driven by individual country strategies rather than regional characteristics, and these hubs often serve as gateways for investment into broader, more heterogeneous regions.
The regional distribution of GARR scores reveals a global system that is not converging, but fragmenting along structural lines. While globalization once encouraged a degree of institutional and economic alignment across regions, the current environment, shaped by geopolitical tensions, technological competition, and climate pressures, is producing more differentiated outcomes. Regions are increasingly defined not only by geography, but by their ability to combine institutional credibility, macroeconomic discipline, and adaptive capacity.
Across the dataset, Europe emerges as the strongest-performing region, with an average GARR score of 87.89, followed by North America (85.78), the Middle East (84.27), and Asia-Pacific (83.87). Latin America (80.00) and Africa (75.68) trail behind. What ultimately distinguishes regions is not only their mean performance, but the depth of their upper tier and the consistency of their institutional foundations.
Europe: Institutional Density and Systemic Resilience
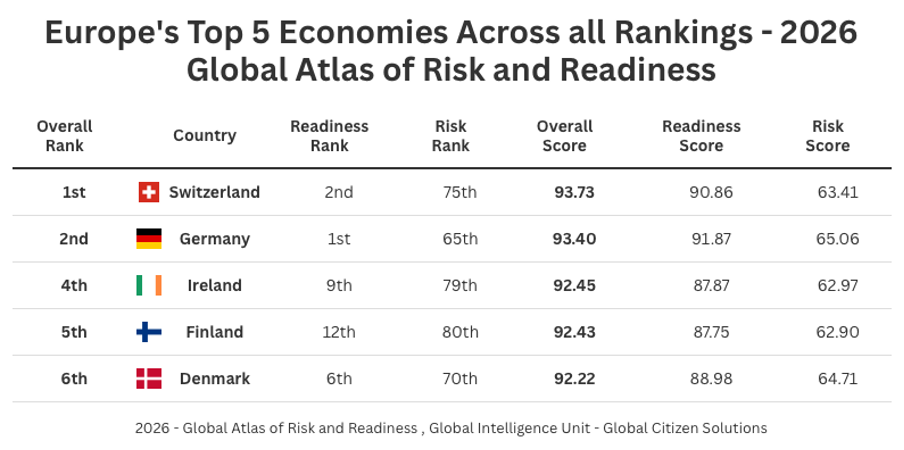
Europe’s dominance in the GARR rankings reflects more than the presence of top-performing countries such as Switzerland (1st) and Germany (2nd). Its defining feature is the density of high-performing jurisdictions, with a broad cluster of countries, Ireland, Finland, Denmark, the Netherlands, Austria, and Sweden, all positioned within the global top tier.
This concentration suggests that Europe’s strength is systemic rather than episodic. Institutional quality, regulatory predictability, and policy continuity are deeply embedded across the region, creating an environment in which resilience is not confined to isolated economies but reinforced through regional integration. As North (1990) emphasizes, institutions reduce uncertainty and enable long-term coordination; Europe’s performance illustrates this principle at scale.
Equally important is the relatively low dispersion within the region. Even mid-ranked economies such as Spain, Portugal, Italy, and Czechia maintain globally competitive scores, reflecting a high institutional baseline. This consistency supports findings from the OECD (2025a, pp. 20-30)), which highlight that well-functioning governance systems and regulatory frameworks are central to sustained economic performance.
From an investment perspective, Europe offers a uniquely layered ecosystem. Core markets provide stability and capital preservation, while secondary markets offer depth and diversification without significantly increasing structural risk. In a fragmented global environment, this combination positions Europe as the most complete regional platform for long-term capital allocation.
North America: Capacity, Scale, and Structural Polarization
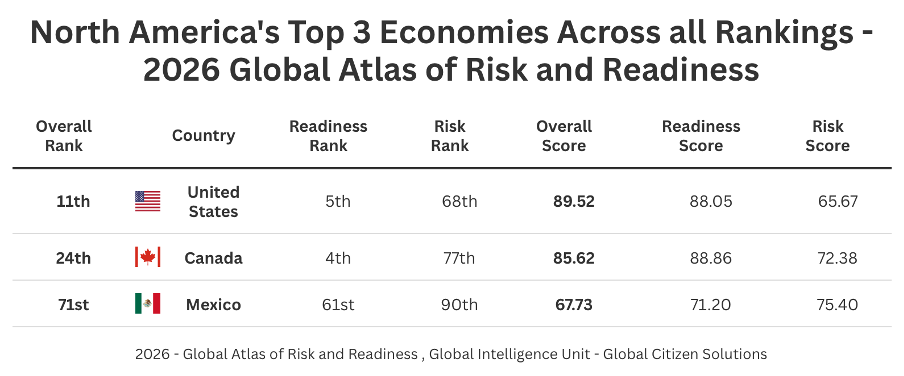
North America presents a markedly different profile. While its regional average of 85.78 places it among the top performers globally, this figure masks substantial internal divergence. The region exhibits the highest dispersion in the dataset, reflecting a sharp contrast between high-capacity and structurally constrained economies.
At one end of the spectrum, Canada (11th) closely resembles leading European economies, combining strong institutional quality with high readiness and relatively contained risk. The United States (24th), while still a top-tier economy, illustrates a more complex profile. Its exceptionally high readiness, driven by technological leadership, capital markets, and innovation ecosystems, is offset by higher structural risk linked to fiscal pressures, political polarization, and regulatory fragmentation.
This divergence reinforces a key insight: economic scale and innovation capacity do not automatically translate into balanced resilience. In the case of the United States, internal sources of volatility (including fiscal imbalances, political uncertainty, financial market sensitivity, and evolving regulatory frameworks) introduce structural volatility, even as the country maintains global leadership in innovation and capital markets (IMF, 2024, pp. 10-55; OECDa, 2025, pp. 43-57).
At the other end of the regional spectrum, Mexico (71st) highlights the persistence of structural gaps within integrated economic regions. Despite its role in North American supply chains and its growing importance in nearshoring strategies, Mexico’s higher risk profile and lower readiness scores reflect ongoing challenges related to governance, infrastructure, and regulatory consistency.
Taken together, North America is best understood as a high-capacity but polarized region, where opportunities are significant but unevenly distributed. For investors, this implies the need for differentiated strategies that account for both the scale advantages of the region and its internal structural disparities.
Latin America: Selective Opportunity in a Structurally Constrained Environment
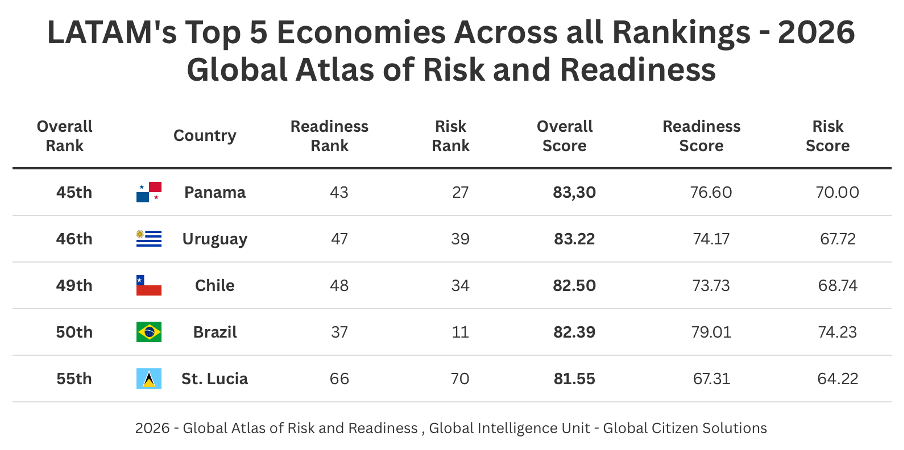
Latin America occupies an intermediate position in the GARR framework, with an average score of 80.00. The region is characterized not by extreme dispersion, but by a relatively narrow clustering at lower levels of performance, reflecting shared structural constraints.
Countries such as Panama, Uruguay, Chile, and Brazil consistently emerge as the region’s strongest performers, demonstrating relative institutional stability, macroeconomic management, and openness to global markets. They attract foreign direct investment, maintain functioning democratic systems, and in some cases have achieved decades of policy continuity.
This gap is not the result of a single deficiency. Rather, it reflects a combination of structural constraints that limit the region’s ability to convert stability into full-spectrum readiness. While Latin America has made significant progress over the past decades, it has not yet achieved the systemic alignment of institutions, innovation, and economic complexity that defines the world’s most resilient economies.
One of Latin America’s most visible achievements has been the strengthening of democratic institutions and macroeconomic governance since the 1990s. Countries like Chile and Uruguay are often cited as regional benchmarks for rule of law, transparency, and policy discipline. Uruguay, for example, has maintained one of the highest levels of political stability and institutional trust in the region, supported by consistent fiscal management and strong social policies.
However, even in these leading cases, institutional consistency remains less robust than in top-ranked global economies. Chile provides a clear illustration. Long regarded as Latin America’s most stable economy, the country entered a period of political uncertainty following the 2019 social unrest and subsequent constitutional reform process. While institutions ultimately proved resilient, the episode highlighted how quickly perceived stability can be tested.
Brazil presents a different dynamic. It possesses sophisticated institutions and a large and diversified economy. Yet, policy continuity is often disrupted by political cycles, with shifts in fiscal policy, regulatory frameworks, and state intervention depending on the administration in power. This creates uncertainty for long-term investors, particularly in infrastructure and energy.
Panama, meanwhile, has built a reputation as a business-friendly hub, supported by its strategic location and the Panama Canal. However, concerns related to transparency, regulatory oversight, and international scrutiny of financial practices continue to affect its institutional credibility.
A second structural constraint lies in the composition of economic activity. While Latin America’s leading economies are integrated into global markets, many remain heavily dependent on commodities or low-complexity exports.
Chile, for instance, is the world’s largest copper producer, and the metal accounts for a significant share of its export revenues. Uruguay relies heavily on agricultural exports, including beef and soybeans. Brazil, despite having a more diversified economy, still depends on commodities such as iron ore, oil, and agricultural products for a substantial portion of its external income.
This structure exposes these economies to global price cycles, making growth more volatile and less predictable. Periods of high commodity prices can generate strong fiscal revenues and investment inflows, but downturns can quickly reverse these gains.
While cities such as São Paulo, Santiago, and Panama City have growing startup ecosystems, the region’s overall investment in research and development remains low. Brazil, the region’s largest economy, invests approximately 1–1.2% of GDP in R&D, compared to over 3% in countries such as Germany or the United States. Smaller economies invest even less.
Innovation is now a core driver of competitiveness, shaping productivity, industrial transformation, and long-term growth. Without deeper innovation systems, Latin American economies risk remaining technology adopters rather than technology leaders, limiting their readiness in a rapidly evolving global landscape.
Macroeconomic management has improved significantly across Latin America, particularly since the adoption of inflation-targeting regimes and more disciplined fiscal frameworks. However, volatility remains higher than in advanced economies.
Another defining feature of Latin America is its high level of inequality, which has far-reaching economic implications. The region remains one of the most unequal in the world, despite improvements in poverty reduction over the past decades.
Inequality affects competitiveness in several ways. It can generate social and political tensions, leading to policy volatility, limit access to education and opportunities, reducing human capital development and constrain domestic consumption and long-term productivity growth
The OECD (2025a, pp. 45-58) emphasizes that inclusive growth is essential for long-term resilience. In Latin America, persistent inequality remains a structural barrier to both stability and readiness, affecting the ability of countries to sustain reforms and attract long-term investment.
Latin America’s challenge is no longer one of basic stability, but of structural transformation. The region has moved beyond the instability of past decades, but it has not yet reached the level of integrated resilience required to compete with global leaders.
Africa: Structural Constraints and Frontier Asymmetry
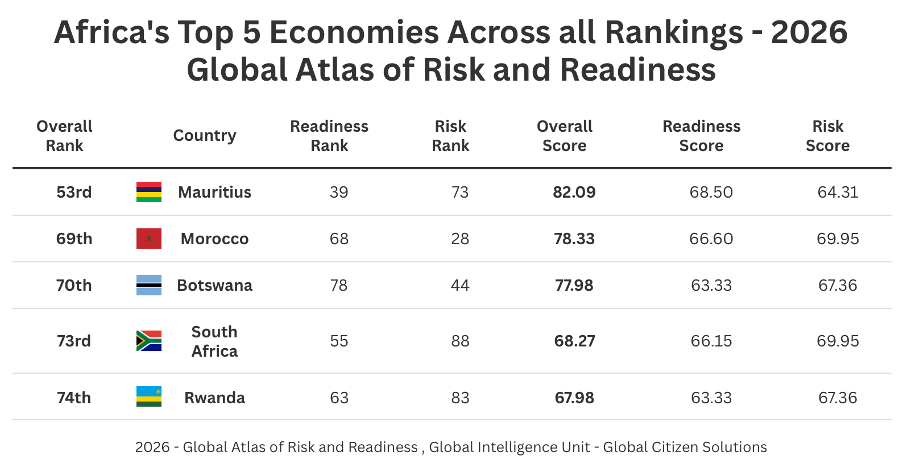
Africa records the lowest regional average in the dataset, at 75.68, reflecting a combination of elevated risk and limited readiness. The region is heavily concentrated in the lower quartile of the rankings, underscoring the extent of its structural challenges.
However, the data also reveals important variation. Mauritius (53rd) stands out as a regional leader, demonstrating how strong governance and policy continuity can significantly improve positioning. Morocco and Botswana also perform relatively well, benefiting from stronger macroeconomic discipline and institutional frameworks than regional peers.
The broader regional pattern, however, is defined by constraints. Countries such as South Africa, Kenya, Ghana, Egypt, and Nigeria face a combination of infrastructure deficits, governance challenges, and macroeconomic instability. Nigeria, despite its demographic scale and economic potential, ranks last overall, highlighting the gap between opportunity and structural readiness.
This aligns with World Bank (2025a, pp.90-110) findings that institutional capacity and infrastructure remain critical constraints on development across much of the continent. At the same time, Africa’s long-term potential remains significant, particularly in sectors such as digital services, energy, and urban infrastructure.
In GARR terms, Africa represents a region of frontier asymmetry. Opportunities exist, but they are uneven, sector-specific, and highly sensitive to execution risk. For investors, this requires a more active and targeted approach than in higher-performing regions.
Asia-Pacific: Dual-Speed Growth and Strategic Complexity
Asia-Pacific is one of the most strategically important regions in the GARR framework, but also one of the least uniform. The region posts an average overall score of 83.87, with an average risk score of 68.94 and an average readiness score of 76.67. What stands out most is dispersion: the regional range runs from 92.60 for Singapore to 73.58 for Cambodia, a spread of just over 19 points.
In practice, this means Asia-Pacific should not be treated as a single investment story. It is a region where world-class innovation hubs, advanced institutional economies, large-scale transition markets, and lower-readiness frontier economies all coexist in the same strategic space.
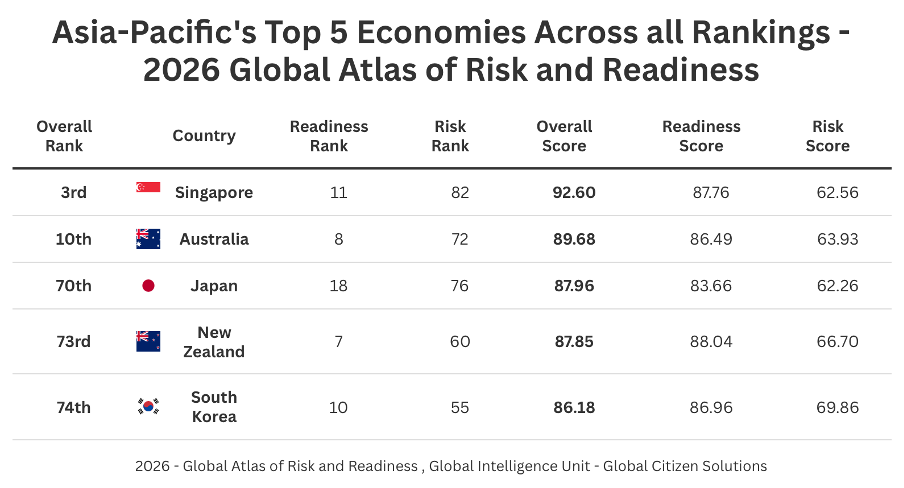
At the top of the regional ranking sits a clear high-readiness core: Singapore (3rd globally, 92.60), Australia (10th, 91.28), New Zealand (16th, 90.70), South Korea (17th, 90.67), and Japan (22nd, 88.55). These five economies average 90.76, well above the regional mean, and they all combine relatively contained risk with strong readiness. These countries represent some of the most future-ready economies globally, particularly in digital and innovation-driven sectors.
Their distinguishing feature is not simply income level, but institutional and technological depth. Singapore, for example, pairs one of the lowest regional risk scores with very high readiness, producing the strongest readiness-over-risk gap in the region. South Korea and Japan score especially well on readiness, reflecting the importance of industrial capability, research intensity, and digital sophistication. This aligns with the World Intellectual Property Organization’s 2025 Global Innovation Index, where the Republic of Korea and Singapore are among the top global innovation performers, and with the OECD’s (2025b, pp. 23-35) work showing that digital government, trusted regulation, and innovation systems are increasingly central to competitiveness (WIPO, 2025, pp. 18-30).
These economies are not risk-free, but they have enough institutional strength and adaptive capacity to absorb shocks without fundamentally undermining investor confidence. That is a meaningful distinction in a period when the IMF has warned that Asia and the Pacific remain resilient overall, but face rising geopolitical tensions, weaker external demand, and medium-term pressure from aging, productivity slowdowns, and policy uncertainty (IMF, 2024c, pp. 1-20). In other words, the region’s strongest performers are not simply growing faster; they are structurally better equipped to handle a more difficult external environment which translates in readiness to adapt and overcome crisis.
Below this core lies a broad middle tier that gives the region its strategic complexity: Taiwan (31st, 86.79), Hong Kong SAR (33rd, 86.59), Malaysia (36th, 85.94), China (41st, 84.41), India (48th, 82.71), Thailand (57th, 81.07), and Indonesia (59th, 80.91). This group averages 84.06, close to the regional mean, but the composition of that average differs sharply from country to country. Taiwan and Hong Kong still display relatively strong readiness, but their overall position is moderated by higher structural and geopolitical sensitivity. Malaysia stands out for a relatively favorable risk score compared with many emerging Asian peers, but its readiness remains below the top core. China and India bring scale, market depth, and strategic importance, yet their GARR positions reflect the fact that size alone does not produce balanced resilience. China’s readiness is solid, but its higher risk score pulls its overall ranking toward the middle of the region. India shows a similar pattern in a different form: very large market potential and clear digital dynamism, but not yet the same level of institutional or systemic readiness as the region’s top performers.
This is where Asia-Pacific’s dual-speed nature becomes most visible. The region includes some of the world’s most advanced economies, but it also includes transition economies that are still moving from growth-driven competitiveness to resilience-driven competitiveness. The Asian Development Bank’s 2025 outlook captures this well: developing Asia remains a faster-growing region than most of the world, but growth is being trimmed by trade friction, policy uncertainty, and a less favorable external environment (Asian Development Bank, 2025, pp. 1-5). The World Bank’s East Asia and Pacific updates make a similar point, noting that the region still grows above the global average, but now faces higher trade restrictions, slower global growth, and the need for deeper reform if it is to sustain quality growth rather than simply volume growth (World Bank, 2025, pp. 43-6).
That distinction between quality and volume is important for interpreting the middle tier. China and India, for example, are indispensable to any serious regional investment strategy because of their scale, but their GARR scores suggest that their investment case is less about pure stability than about selective exposure to transformation. China remains central to global manufacturing, clean-energy supply chains, and industrial capability. The IEA notes that China is both the world’s largest energy consumer and a leading clean-energy powerhouse, while WIPO’s 2025 results place China in the global innovation top 10 (IEA, 2025, pp. 5-15, 60-90; WIPO, 2025, pp. 18-30). Yet the regional ranking data suggests that these strengths do not fully offset concerns around regulatory complexity, external tensions, and systemic risk. India, meanwhile, benefits from demographic scale, digital public infrastructure, and continued growth momentum, but its readiness score shows that the institutional and infrastructural foundations of resilience are still catching up with its economic ambition.
The lower tier of the region underscores the difference between opportunity and resilience. Vietnam (67th, 79.12), the Philippines (68th, 78.83), Kazakhstan (72nd, 77.05), Sri Lanka (77th, 74.92), and Cambodia (82nd, 73.58) all score materially below the regional mean, with weaker readiness profiles and narrower capacity to absorb shocks. This is also the point where the readiness-minus-risk balance turns more relevant. Vietnam and the Philippines remain attractive growth stories, but their risk-adjusted profile is weaker than that of the regional middle tier. Sri Lanka and Cambodia sit lower still, reflecting both higher vulnerability and lower systemic preparedness.
That lower tier does not imply absence of opportunity. Vietnam is a good example of how a country can rank in the lower regional half while still offering a compelling investment narrative. Its role in “China+1” supply-chain diversification, strong export performance, and continued manufacturing inflows have made it one of the region’s most important strategic beneficiaries of global production realignment. The US Department of State notes that Vietnam’s cumulative FDI stock exceeded $320 billion (US Department of State, 2025) and the World Bank has continued to project strong growth relative to regional peers.
But the GARR data shows why growth alone is not enough: Vietnam’s lower readiness score means that while opportunity is real, institutional and systemic resilience still lag behind its growth narrative. Cambodia shows the same logic in a more constrained form. It has benefited from export manufacturing and infrastructure inflows, yet the World Bank has also highlighted macro-financial vulnerabilities, including private debt and banking-sector stress, that make resilience more fragile.
For investors, that is the central message of the region. Asia-Pacific offers both core holdings and higher-beta growth markets, but these should not be evaluated with the same framework. The top core economies are suited to long-horizon capital seeking policy continuity, innovation exposure, and lower structural volatility. The middle tier offers selective upside tied to industrial upgrading, digitalization, and market deepening, but with more visible governance, geopolitical, or macro constraints. The lower tier offers higher-growth and sometimes higher-return opportunities, yet these are typically more dependent on timing, sector selection, and external conditions.
Energy and technology strengthen this interpretation. Asia-Pacific is now central to the global energy transition as well as to digital production networks. The IEA describes the region as pivotal to the global energy future, and notes that Southeast Asia in particular is seeing major clean-energy investment alongside persistent dependence on coal and continuing energy-security concerns. That combination mirrors the broader regional pattern in GARR: strong momentum, but uneven resilience. Likewise, OECD work on digital public infrastructure and SME digitalization suggests that digital capability can accelerate competitiveness, but only when supported by governance quality, financing, and execution capacity (OECDb, 2025, pp. 20-40).
The capital-flow picture reinforces this dual-speed reading. UNCTAD’s 2025 World Investment Report shows that FDI in developing Asia remains large but uneven, with South-East Asia showing rising inflows even as East Asia weakens (UNCTAD, 2025, pp. 15-30, 40-55). That is consistent with what your regional scores imply: Asia-Pacific is not losing relevance, but capital is becoming more selective inside the region, rewarding jurisdictions that combine market opportunity with institutional depth and penalizing those where readiness remains too shallow to absorb risk.
The broader conclusion is that Asia-Pacific is not merely dynamic; it is strategically layered. Its strongest economies show that the region can produce world-class resilience through institutional quality, innovation, and infrastructure. Its middle tier shows how scale and transition can create large opportunity sets without fully resolving structural risk. Its lower tier shows the limits of growth when readiness remains underdeveloped. For investors, that makes Asia-Pacific indispensable—but also demanding. It is a region where upside is abundant, but where the difference between durable compounding and episodic returns depends on how well risk and readiness are balanced.
Middle East: State-Led Transformation, Gulf Resilience, and the Limits of Readiness Under Conflict
The Middle East is not a uniformly high-performing region; it is a region in transition, where a Gulf-centered reform story is lifting overall performance while geopolitical risk continues to constrain the outer limits of resilience. The region ranges from the United Arab Emirates at 91.69 (9th globally) to Israel at 80.66 (61st), with a standard deviation of 3.82, meaning the region is less dispersed than Asia-Pacific, but still far from homogeneous. The most important regional pattern is that state-led transformation in the Gulf is materially improving readiness, even as regional conflict continues to test risk absorption.
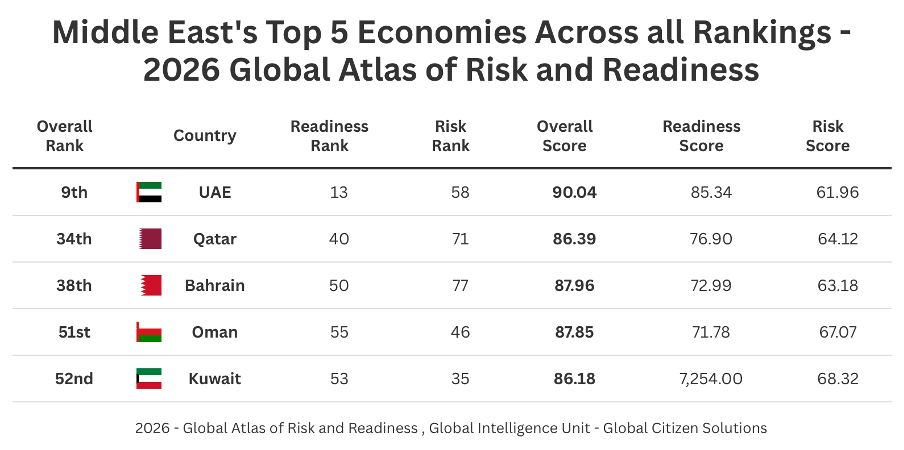
The Gulf Cooperation Council economies are the clearest expression of this transformation. Data shows that the six Gulf markets, the United Arab Emirates, Qatar, Bahrain, Oman, Kuwait, and Saudi Arabia, average 84.87 overall, slightly above the regional mean, with an average risk score of 65.60 and an average readiness score of 75.34. What is striking is not just the level of the scores, but their composition. These economies are no longer competing only on hydrocarbon wealth or fiscal buffers. They are increasingly competing on infrastructure quality, digitalization, logistics, energy strategy, luxury and the institutional execution of national transformation plans.
The United Arab Emirates stands out as the regional benchmark. It ranks 9th globally in your spreadsheet, with an overall score of 91.69, a risk score of 61.96, and a readiness score of 85.34. That places it not merely at the top of the Middle East, but close to the leading European and Asia-Pacific cluster. This is a significant result. It suggests that the UAE has moved beyond the traditional Gulf model of resource-backed stability into something closer to a high-readiness diversification platform.
That interpretation is consistent with the World Bank’s 2025 Gulf Economic Update, which argues that GCC growth has been supported by structural reforms, digital innovation, and a decade-long push toward diversification, with the UAE among the strongest performers in the region (World Bank, 2025, pp. 5-15, 20-30). It is also consistent with the IMF’s 2025 Regional Economic Outlook for the Middle East and Central Asia, which notes that reform momentum, stronger non-oil activity, and fiscal discipline are key drivers of resilience in Middle Eastern economies despite persistent global uncertainty and geopolitical tension (IMF, 2025a, 1-10).
Behind the UAE sits a second Gulf tier made up of Qatar (34th, 86.39), Bahrain (38th, 84.91), Oman (51st, 82.35), Kuwait (52nd, 82.11), and Saudi Arabia (54th, 81.77). These scores are relevant because they show that Gulf resilience is not confined to a single outlier. Qatar combines a relatively strong overall score with a readiness score of 76.90, suggesting that its gas-based wealth is increasingly being translated into broader structural capacity. Bahrain, with 84.91 overall, performs better than might be expected from a smaller economy, reflecting the role of services, logistics, and policy adaptation. Oman and Kuwait remain more moderate, while Saudi Arabia—despite its scale and strategic importance, still sits lower in the ranking than the UAE or Qatar.
Saudi Arabia is especially instructive. Data reveals it scores 81.77 overall, with a risk score of 68.95 and a readiness score of 72.48. That profile suggests an economy that is improving, but not yet as balanced as the region’s leaders. The World Bank analysis is align with this interpretation as it argues that sustaining Gulf momentum will require continued progress on national Vision strategies and disciplined fiscal management to reduce vulnerability to oil-price swings and geopolitical shocks (World Bank, 2025c, pp 15-25). The Saudi case fits that description closely: the country is investing heavily in logistics, tourism, energy transition, and industrial strategy, but the GARR data suggests that the translation of investment into fully systematized readiness is still in progress rather than complete.
This is where the Gulf region becomes especially important analytically. It demonstrates that in the Middle East, readiness is increasingly built through state-led investment rather than through purely market-led evolution. Large-scale infrastructure projects, sovereign investment strategies, digital transformation agendas, and energy-system repositioning are functioning as the main channels through which these economies are improving competitiveness.
That interpretation is reinforced by the International Energy Agency, which describes the Middle East and North Africa as being at a pivotal stage in its energy trajectory, being still a cornerstone of global oil and gas supply, but increasingly shaped by rising electricity demand, solar investment, nuclear expansion, and efforts to free hydrocarbons for export or higher-value use (IEA, 2025a, pp-80-110). The IEA also notes that solar capacity in the wider MENA region is set to rise sharply through 2035, while natural gas remains central to power systems and energy security (IEA, 2025b, pp. 120-40).
That said, the region’s resilience story cannot be separated from its geopolitical environment. This is where Israel provides a critical counterpoint. The country ranks 61st globally, with an overall score of 80.66. What makes Israel analytically important is the imbalance between its two pillars: it records a high readiness score of 80.21, but also a very high risk score of 78.90 lately. This makes Israel the clearest regional example of the proposition that readiness can compensate for risk only up to a point. Its innovation capacity, human capital, and technological depth remain substantial, but these strengths are not enough to neutralize the weight of geopolitical exposure in the final composite result.
This tension has become even more relevant in light of the escalation of conflict in early 2026 involving Iran, the United States, and Israel, which has materially altered the region’s risk profile. The International Energy Agency has consistently highlighted the strategic vulnerability of energy flows through chokepoints such as the Strait of Hormuz, where disruptions can have immediate and far-reaching effects on global oil and gas markets (IEA, 2025). Recent reporting indicates that the conflict has heightened risks to energy infrastructure and commercial shipping routes, while also influencing U.S. military positioning and broader Gulf security dynamics (Associated Press, 2026). Together, these developments reinforce the sensitivity of the region’s economic outlook to geopolitical shocks, particularly in the energy sector.
The regional profile therefore suggests a more nuanced conclusion than conventional narratives about the Middle East often allow. The region is not best understood as a simple high-risk zone. Rather, it is a region where risk remains elevated, but readiness is improving unevenly through state-led transformation. The Gulf economies, especially the UAE, and to a lesser extent Qatar and Bahrain, demonstrate that structural reform, digitalization, and energy-system strategy can materially improve risk-adjusted competitiveness. Saudi Arabia, Oman, and Kuwait show the same direction of travel, even if the convergence process is still incomplete. Israel demonstrates the opposite lesson: that even a highly capable economy can be pulled down sharply when geopolitical risk intensifies.
Beneath the surface of scores and positions lies a set of consistent patterns that challenge traditional assumptions about stability, growth, and competitiveness. These patterns reveal a world that is not converging toward uniform development, but fragmenting into distinct trajectories defined by how effectively countries manage the relationship between risk and readiness.
Readiness – the true deliver of competitiveness:
At the core of these findings is a fundamental shift in what drives competitiveness. The data clearly shows that readiness (not the absence of risk) is the primary determinant of performance. Across the highest-ranking economies, readiness scores consistently cluster between approximately 85 and 92, while risk remains more variable. This indicates that countries do not reach the top of the rankings because they are free of structural vulnerabilities, but because they possess the institutional capacity, innovation systems, and human capital required to manage them effectively. Switzerland (93.73), Germany (93.40), and Singapore (92.60) exemplify this dynamic, demonstrating that resilience is achieved through capability rather than insulation.
Risk constrains readiness:
This relationship introduces an important asymmetry. While high readiness can coexist with moderate levels of risk, the inverse is rarely observed. Countries with elevated risk scores (typically above 80) almost never achieve high readiness levels, which tend to remain below 70 in such environments. This suggests that systemic risk acts as a structural constraint, limiting the accumulation of institutional and economic capacity. The reality is risk does not merely coexist with lower readiness; it actively restricts it.
Convergence at the Top, Divergence Below:
These dynamics are reflected in the broader distribution of scores. At the top of the rankings, countries converge within a remarkably narrow band, with less than three points separating the top ten economies. This compression indicates that once a certain threshold of institutional quality and economic sophistication is reached, performance becomes increasingly similar across countries. Below this frontier, however, divergence becomes more pronounced. The global system, therefore, resembles a frontier model, where convergence occurs only among the most advanced economies, while divergence dominates elsewhere.
The Rise of Strategic Hubs:
Certain countries stand out as structural outliers, outperforming their regional peers and acting as strategic hubs within the global system. Singapore and the United Arab Emirates are particularly illustrative. Singapore’s position (3rd, 92.60) reflects its ability to combine strong governance with advanced technological capacity, while the UAE (9th, 91.69) demonstrates how targeted investment and diversification can rapidly elevate readiness. These economies function not only as high-performing jurisdictions, but as nodes of capital, innovation, and connectivity. Their role suggests that global investment flows are increasingly shaped by networks and hubs.
Small vs Large – Agility and specialization vs Scale:
The data also shows that both small and large economies can achieve high levels of competitiveness, but through different mechanisms. Smaller economies such as Switzerland, Singapore, and Denmark succeed through institutional coherence, policy agility, specialization and deep integration into global systems. Larger economies such as the Germany, the US and China leverage scale, diversification, and capital market depth to achieve similar outcomes. However, scale also introduces complexity. In the United States, for example, very high readiness is accompanied by elevated risk linked to fiscal pressures and political polarization (IMF, 2024; OECD, 2025).
High-Risk Markets Conditional Opportunities:
A further layer of complexity emerges when considering the nature of risk itself. The data suggests that risk is not homogeneous, but takes different forms with distinct implications for investment. In countries such as Argentina and Türkiye, risk is largely cyclical, driven by macroeconomic instability and policy volatility. In Nigeria, it is more structural, linked to governance challenges and infrastructure gaps. In Russia and Israel, geopolitical factors play a dominant role. These distinctions matter because they shape not only the level of risk, but the type of opportunity available. In high-risk environments, returns are often driven by timing, sector selection, and the ability to navigate volatility, rather than by long-term stability.
This is particularly evident in lower-ranked economies, where structural constraints coexist with pockets of opportunity. Argentina’s debt cycles, Türkiye’s export sectors, and Nigeria’s fintech ecosystem illustrate how elevated risk can create entry points for investors capable of managing complexity (Partech Africa, 2023; World Bank, 2024). However, these opportunities are conditional. They depend on factors such as currency stability, regulatory clarity, and market liquidity, and are typically accessible only to investors with specialized knowledge and risk management capabilities. As a result, these markets function less as core destinations for capital and more as complementary allocations within diversified portfolios.
Ultimately, the most important insight emerging from the GARR framework is that the global system is not converging, but stratifying. A relatively small group of countries is consolidating high levels of readiness, supported by strong institutions, innovation capacity, and policy credibility. At the same time, a broader set of economies remains constrained by structural vulnerabilities, with limited capacity to close the gap. This divergence reflects the growing importance of institutional quality and adaptability in shaping long-term outcomes.
The findings of the Global Atlas of Risk and Readiness point to a clear shift in how competitiveness and investment attractiveness should be understood in a more fragmented global environment. As the analysis shows, the distinction between risk and readiness is not merely analytical, but strategic: countries are increasingly differentiated by their capacity to manage uncertainty rather than avoid it. This has important implications for both investors and policymakers.
For Investors
Prioritizing Readiness in Capital Allocation
A central implication of the GARR framework is that readiness should increasingly anchor investment decisions. The analysis suggests that long-term performance is less about identifying environments with minimal risk and more about identifying those with the institutional strength and adaptive capacity to manage it effectively. Economies such as Switzerland, Germany, and Singapore illustrate how strong governance, innovation systems, and human capital create conditions where capital can remain resilient even amid external shocks.
From Markets to Systems: Investing in Ecosystems
Another important shift concerns the growing relevance of systems over individual opportunities. Investment outcomes are increasingly linked to broader ecosystems, including innovation clusters, financial hubs, and integrated regional markets. Countries that function as nodes within global networks, such as Singapore or the United Arab Emirates, offer not only domestic opportunities but also access to wider flows of capital, talent, and information.
Interpreting the Nature of Risk
The analysis also highlights the importance of distinguishing between different forms of risk. Macroeconomic volatility, structural institutional weaknesses, and geopolitical exposure do not affect investment outcomes in the same way, nor do they require identical approaches. A more nuanced understanding of these differences can help investors better assess both constraints and opportunities across markets.
Aligning Investment Horizons with Structural Conditions
Time horizon emerges as another important dimension. High-readiness economies tend to support long-term strategies focused on steady value creation, while markets with higher volatility often reward more tactical and timing-sensitive approaches. Aligning investment horizons with structural conditions may therefore improve both risk management and return consistency.
For Countries
Strengthening Institutional Foundations
For policymakers, the findings reinforce the central role of institutional quality in shaping competitiveness. Across the highest-performing economies, consistent patterns emerge around rule of law, regulatory predictability, and governance effectiveness. These factors appear not only to attract capital, but also to support its long-term retention by reducing uncertainty and enabling stable economic planning.
From Growth to Capability
The analysis also suggests that traditional growth metrics are becoming less decisive on their own. While economic expansion remains important, it is increasingly complemented—and in some cases outweighed—by a country’s ability to build readiness through innovation, human capital development, and economic diversification.
Reducing Structural Risk to Enable Progress
At the same time, reducing structural sources of risk remains a necessary condition for sustained improvement. High levels of macroeconomic volatility, fiscal imbalances, or political instability tend to limit the development of institutional and economic capacity over time. Addressing these constraints can therefore play a dual role, stabilizing the environment while enabling further gains in readiness.
Building Technological and Energy Capacity
Technological capability and energy resilience emerge as increasingly central dimensions of competitiveness. Economies that invest in digital infrastructure, innovation systems, and reliable energy frameworks appear better positioned to adapt to structural change and sustain long-term growth.
Strategic Positioning in a Networked World
Finally, the experience of several high-performing economies highlights the importance of strategic positioning. Smaller countries, in particular, demonstrate that scale is not the only path to competitiveness. Through integration, specialization, and policy coherence, they can position themselves as key nodes within global networks of trade, finance, and innovation.
The Global Atlas of Risk and Readiness points to a decisive shift in the structure of the global economy. The evidence no longer supports a narrative of convergence toward common growth models. Instead, the global system is becoming increasingly stratified, shaped by differences in institutional strength, adaptive capacity, and exposure to structural risk.
At the core of this shift is the growing importance of readiness. While risk remains a defining constraint, it is the capacity to manage it that ultimately determines long-term performance. Economies such as Switzerland, Germany, and Singapore illustrate this clearly: resilience is not achieved by minimizing vulnerability, but by building the institutional, technological, and human capital capabilities required to absorb and adapt to shocks.
At the same time, the analysis highlights a widening divide between countries operating at the high-readiness frontier and those constrained by structural limitations. This divergence cuts across regions and income levels, underscoring that geography alone is no longer a reliable predictor of competitiveness. Instead, capital, talent, and innovation are increasingly concentrating in jurisdictions that combine policy credibility, institutional consistency, and technological capacity. The result is a more fragmented and selective global landscape.
For investors, this shift requires a more precise approach to risk. The objective is no longer to avoid uncertainty, but to understand where it can be effectively managed. Markets should be evaluated not only on growth potential, but on the strength of the systems that support long-term value creation.
For policymakers, the message is equally clear. Competitiveness is no longer secured through growth alone. It depends on the ability to build and sustain institutional quality, foster innovation, and maintain policy consistency over time. Countries that succeed in strengthening these foundations are better positioned to attract capital and navigate volatility; those that do not risk falling further behind.
More broadly, the GARR framework reflects a shift in the logic of global capital allocation. The countries that will lead are not those with the least exposure to risk, but those best equipped to manage it.
The Global Atlas of Risk and Readiness provides a structured lens through which to interpret this dynamic, offering a clearer view of where resilience is being built, where vulnerabilities persist, and how both investors and governments can navigate an increasingly complex global system.
References
Acemoglu, D., & Robinson, J. A. (2012). Why nations fail: The origins of power, prosperity, and poverty. Crown Publishing Group.
Asian Development Bank. (2025). Asian development outlook 2025. https://www.adb.org
Bank for International Settlements. (2024). Annual economic report 2024. https://www.bis.org/publ/arpdf/ar2024e.htm
Bank for International Settlements. (2025). Annual economic report 2025. https://www.bis.org
Burke, M., Hsiang, S. M., & Miguel, E. (2015). Global non-linear effect of temperature on economic production. Nature, 527(7577), 235–239. https://doi.org/10.1038/nature15725
Busse, M., & Hefeker, C. (2007). Political risk, institutions and foreign direct investment. European Journal of Political Economy, 23(2), 397–415. https://doi.org/10.1016/j.ejpoleco.2006.02.003
Caldara, D., & Iacoviello, M. (2022). Measuring geopolitical risk. American Economic Review, 112(4), 1194–1225. https://doi.org/10.1257/aer.20191823
Cisco. (n.d.). Digital readiness index. https://www.cisco.com/c/en/us/about/csr/research-resources/digital-readiness-index.html
Fischer, S. (1993). The role of macroeconomic factors in growth. Journal of Monetary Economics, 32(3), 485–512. https://doi.org/10.1016/0304-3932(93)90027-D
Hausmann, R., Hidalgo, C. A., Bustos, S., Coscia, M., Simoes, A., & Yıldırım, M. A. (2014). The atlas of economic complexity: Mapping paths to prosperity. MIT Press.
Institute for Economics & Peace. (2025). Global peace index 2025. https://www.economicsandpeace.org/reports/
International Energy Agency. (2025a). World energy outlook 2025. https://www.iea.org
International Energy Agency. (2025b). Energy security in a fragmented world. https://www.iea.org
International Energy Agency. (2026). Global energy market update 2026. https://www.iea.org
International Monetary Fund. (2023). Geoeconomic fragmentation and foreign direct investment. In World economic outlook. https://www.imf.org/en/Publications/WEO
International Monetary Fund. (2024a). World economic outlook. https://www.imf.org/en/Publications/WEO
International Monetary Fund. (2024b). Fiscal monitor. https://www.imf.org/en/Publications/FM
International Monetary Fund. (2024c). Regional economic outlook: Asia and Pacific. https://www.imf.org
International Monetary Fund. (2025a). Regional economic outlook: Middle East and Central Asia. https://www.imf.org
International Monetary Fund. (2025b). World economic outlook update. https://www.imf.org
North, D. C. (1990). Institutions, institutional change and economic performance. Cambridge University Press. https://doi.org/10.1017/CBO9780511808678
Notre Dame Global Adaptation Initiative. (n.d.). ND-GAIN country index. https://gain.nd.edu/our-work/country-index/
Organisation for Economic Co-operation and Development. (2025a). OECD economic outlook 2025. https://www.oecd.org/economic-outlook/
Organisation for Economic Co-operation and Development. (2025b). OECD regulatory policy outlook 2025. https://www.oecd.org/gov/regulatory-policy/
Organisation for Economic Co-operation and Development. (2025c). FDI regulatory restrictiveness index. https://www.oecd.org/investment/fdiindex.htm
Partech Africa. (2023). Africa tech venture capital report 2023. https://partechpartners.com
Rajkovic, N. M. (2022). Transnational law and power: A network perspective. Cambridge University Press.
Reinhart, C. M., & Rogoff, K. S. (2009). This time is different: Eight centuries of financial folly. Princeton University Press.
Rodrik, D. (2013). The past, present, and future of economic growth. Global Citizen Foundation.
Rodrik, D. (2021). Why does globalization fuel populism? Economics, culture, and the rise of right-wing populism. Annual Review of Economics, 13, 133–170. https://doi.org/10.1146/annurev-economics-070220-032416
Summers, L. H. (2006). Reflections on global account imbalances and emerging markets. Harvard University.
United Nations Conference on Trade and Development. (2024). World investment report 2024. https://unctad.org/publication/world-investment-report-2024
United Nations Conference on Trade and Development. (2025). World investment report 2025. https://unctad.org
U.S. Department of State. (2025). Investment climate statements: Vietnam. https://www.state.gov
World Bank. (2024a). World development indicators. https://databank.worldbank.org/source/world-development-indicators
World Bank. (2024b). Human capital index. https://www.worldbank.org/en/publication/human-capital
World Bank. (2025a). Global economic prospects. https://www.worldbank.org/en/publication/global-economic-prospects
World Bank. (2025b). Gulf economic update. https://www.worldbank.org
World Bank. (n.d.). Worldwide governance indicators. https://www.worldbank.org/en/publication/worldwide-governance-indicators
World Economic Forum. (2025c). Global risks report 2025. https://www.weforum.org/reports/global-risks-report-2025/
World Intellectual Property Organization. (2025). Global innovation index 2025. https://www.wipo.int/global_innovation_index/
World Energy Council. (2024). World energy trilemma index 2024. https://www.worldenergy.org/transition-toolkit/world-energy-trilemma-index