When people talk about “powerful” passports, they usually mean one thing: how many countries you can enter visa-free. Yet, for globally mobile individuals considering relocation, second residency, or a new citizenship, mobility is only half the story. The other half, quality of life, is also fundamental.
To answer that question, Global Citizen Solutions’ Global Passport Index (GPI) separates overall passport strength into three pillars: Enhanced Mobility, Investment, and Quality of Life. The Quality of Life Index isolates how attractive a country is as a place to live if you are thinking about a second residency and international relocation.
This article focuses on that third dimension of the GPI. It explains the methodology behind the Quality of Life Index, presents the top 10 countries, traces their evolution since 2021, and then offers a regional breakdown of the leading passports by continent. Finally, it reflects on why certain countries have improved, based on the underlying metrics, and what this means for international movers and investors.

Quality of life is one of the most widely used yet debated concepts in the study of human well-being, international development, and comparative social policy. Scholars, international organizations, and policymakers have long recognized that assessing how well people live cannot rely on economic metrics alone, though such indicators help frame the broader picture((The expression quality of life entered scholarly and policy discourse in the mid-20th century, initially appearing in the 1940s in discussions about postwar social welfare and living conditions, but it became firmly established as an academic concept during the 1960s and 1970s with the rise of the social indicators movement and growing dissatisfaction with GDP as the sole measure of societal progress. Influenced by the World Health Organization’s broad definition of health as encompassing physical, mental, and social well-being (WHO, 1946), scholars in sociology, economics, and psychology began to conceptualize quality of life as a multidimensional construct combining objective conditions and subjective evaluations (Andrews & Withey, 1976; Campbell, Converse, & Rodgers, 1976). By the late 20th century, the concept was further formalized through standardized measurement tools, particularly in health and public policy research, solidifying its status as a core interdisciplinary framework for assessing human well-being. Andrews, F. M., & Withey, S. B. (1976). Social indicators of well-being: Americans’ perceptions of life quality. Springer; Campbell, A., Converse, P. E., & Rodgers, W. L. (1976). The quality of American life: Perceptions, evaluations, and satisfactions. Russell Sage Foundation and World Health Organization. (1946). Constitution of the World Health Organization. WHO.)). A meaningful evaluation must instead capture the multidimensional conditions that enable individuals not only to survive but to develop fully in all aspects of life. The Quality of Life pillar of the GPI follows this intellectual tradition, drawing on years of research to offer a holistic and migration-relevant measure of well-being across countries.
The academic literature provides several influential approaches to conceptualising quality of life. Ruut Veenhoven, a pioneer of empirical happiness research, argues that quality of life encompasses both objective life chances, such as safety, health, or environmental conditions, and subjective life outcomes, including enjoyment of life and overall satisfaction with living((Veenhoven, R. (2000). The four qualities of life: Ordering concepts and measures of the good life. Journal of Happiness Studies, 1(1), 1–39, and Veenhoven, R. (2010). How universal is happiness? Social Indicators Research, 97(1), 1–10.)). Veenhoven’s perspective makes it clear that quality of life is profoundly shaped by where you live. In his model, wellbeing arises from the dynamic interaction between the individual and their environment, meaning that a person’s life satisfaction depends not only on their internal abilities and choices but also on the external conditions surrounding them. These include safety, public services, environmental quality, economic stability, and social attitudes, factors that vary greatly across countries. In other words, wellbeing is not something individuals carry with them independently of place. Rather, it is co-created by personal capabilities (health, education, resilience and the livability of the location), in other words, the social, political, and ecological context in which daily life unfolds. This is why two people with similar backgrounds may experience dramatically different levels of wellbeing depending on where they reside. A supportive, safe, and inclusive environment enhances wellbeing, while a stressful or unstable environment undermines it.
This resonates strongly with the capability approach advanced by Amartya Sen, who argues that the true measure of quality of life lies in what individuals are substantively free to do and to be: whether they can live long and healthy lives, participate in society, make meaningful choices, pursue education, and exercise personal and political freedoms((Sen, A. (1993). Capability and well-being. In M. Nussbaum & A. Sen (Eds.), The quality of life (pp. 30–53). Oxford University Press. Retrieved from https://global.oup.com/academic/product/the-quality-of-life-9780198287971 and Sen, A. (1999). Development as freedom. Oxford University Press.)). Freedom is a core element in Sen’s definition of quality of life, and his framework explains why individuals may choose to live in countries that offer greater civil liberties, legal security, social protection, and life-course opportunities, because such environments expand their freedom to choose lives they value.
This approach has informed the work of international organisations, particularly the United Nations Development Programme (UNDP) and its Human Development Index (HDI), which combines life expectancy, educational outcomes, and income levels into an accessible measure of human development((United Nations Development Programme. (2025). Human Development Report 2024/25. UNDP. Retrieved from https://report.hdr.undp.org/working-toward-AI-augmented-human-development )). Similarly, the OECD Better Life Index and the World Happiness Report helped mainstream multidimensional wellbeing by shifting international attention beyond GDP toward a broader set of indicators capturing how people actually experience life((Helliwell, J. F., Layard, R., Sachs, J. D., De Neve, J.-E., Aknin, L. B., & Wang, S. (Eds.). (2025). World Happiness Report 2025. Wellbeing Research Centre, University of Oxford. Retrieved from https://www.worldhappiness.report and OECD. (2025). OECD Better Life Index 2024. Organisation for Economic Co-operation and Development. Retrieved from https://www.oecd.org/en/data/tools/well-being-data-monitor/better-life-index.html)).
It is relevant to mention that scholars caution that they are not without limitations. Critics argue that composite indicators may oversimplify complex social realities, embed cultural biases in the weighting of variables, or rely too heavily on subjective perceptions that do not always reflect structural inequalities((Jany-Catrice, F. (2012). The new indicators of well-being and quality of life: A critical perspective. Social Indicators Research, 109(1), 1–20. Retrieved from https://doi.org/10.1007/s11205-012-0054-1; Annas, J. (2004). Happiness as achievement. Daedalus, 133(2), 44–51. Retrieved from https://doi.org/10.1162/001152604323049370 and Alexandrova, A. (2017). A philosophy for the science of well-being. Oxford University Press.)). Others note that such indexes can obscure intra-national variation, masking disparities between different regions or demographic groups((Kautto, M. (2010). The Nordic countries. In F. G. Castles et al. (Eds.), The Oxford handbook of the welfare state (pp. 586–600). Oxford University Press and Vitterso, J. (Ed.). (2016). Handbook of eudaimonic well-being. Springer. )). Still, despite these methodological constraints, quality of life indexes remain valuable tools for assessing collective conditions across countries. They offer a coherent framework for comparing well-being, highlight long-term social strengths and weaknesses, and provide a useful lens for policymakers, researchers, and internationally mobile individuals seeking to understand broad contextual differences between nations.
The Global Citizen Solutions’ Quality of Life Index, one of the three dimensions of the GPI, draws from these traditions but applies them specifically to the context of international mobility, relocation, and second citizenship. Rather than asking how populations fare in general, this pillar answers a practical question for globally mobile individuals: If I were to relocate to this country, how good would my life be there, all things considered?
To answer this, the Index integrates a wide range of internationally recognised indicators from the UN, World Bank, OECD, Yale’s Environmental Performance Index, the World Happiness Report, Migrant’s Acceptance Gallup Survey, and specialised migration datasets, among others. The resulting composite metric captures both the objective conditions that shape everyday life and the subjective experiences that influence whether people feel fulfilled, welcomed, and at ease in a new environment.
The Quality of Life dimension is structured around several key indicators:
- Sustainable Development and Human Development: incorporating UN SDG progress, HDI components, health outcomes, education levels, and income measures. This reflects the long-term socio-economic foundations of wellbeing.
- Cost of Living and Economic Affordability: focusing on concrete expenses such as housing, consumer prices, and purchasing power, metrics highly relevant to expats, investors, retirees, and digital nomads who must assess whether everyday life is financially sustainable.
- Personal and Political Freedoms: drawing from Freedom House, V-Dem, and the World Bank Governance Indicators, reflecting Sen’s emphasis on freedom as central to a life worth living.
- Happiness and Subjective Well-Being: through survey-based data, especially from the World Happiness Report, which captures life satisfaction, social trust, and perceived freedoms.
- Environmental Sustainability and Infrastructure: uses data from the Yale EPI, OECD climate assessments, and environmental health metrics, aligning with research showing that environmental quality is a key determinant of wellbeing.
- Migrant Acceptance and Social Inclusion: a dimension uniquely relevant to the GPI. Drawing on Gallup’s Migrant Acceptance Index and OECD integration datasets, this component acknowledges that the lived experience of newcomers depends not only on national wealth or safety, but also on social attitudes, cultural openness, and institutional support.
In combining academic insights, international standards, and migration-relevant indicators, the Quality of Life pillar provides one of the most comprehensive and practical assessments of where in the world people can expect to live well. It reflects a contemporary vision of wellbeing, one that recognizes that the good life is multidimensional, that freedoms matter as much as incomes, and that the experience of newcomers is a crucial part of evaluating national attractiveness in an increasingly mobile world.
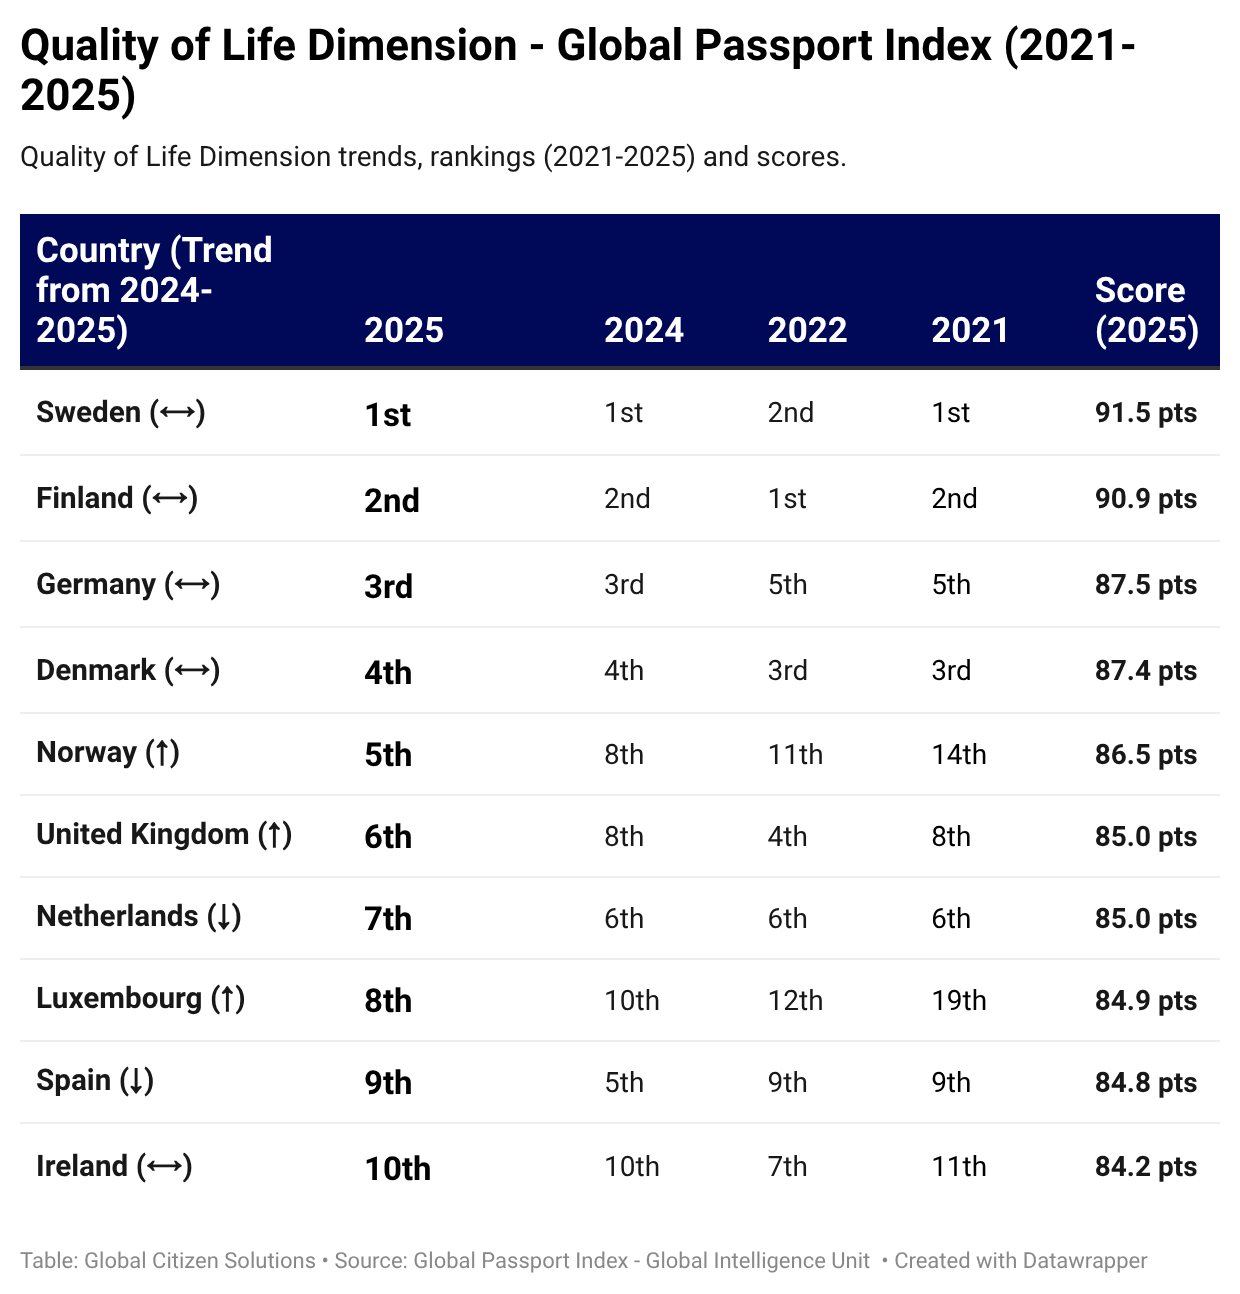
The latest results of the Global Passport Index’s Quality of Life dimension reaffirm a pattern that has been emerging over the past decade in comparative wellbeing research: the countries that offer the highest quality of life for globally mobile individuals are overwhelmingly European, with the Nordic nations occupying a particularly dominant position. According to 2025 data, the top ten performers (table below) show both consistently high scores and a visible trajectory of improvement from 2021 to 2025.
For full Quality of Life Index click here.
Sweden, Finland, Germany and Denmark maintain long-standing leadership thanks to their balanced social models and consistently high living standards. Their stability at the top reflects systems that have been fine-tuned over decades, allowing them to deliver reliable results year after year. This continuity sets the tone for the rest of the ranking, reinforcing a sense of maturity and resilience across the region.
Amid these established leaders, several countries show meaningful upward momentum. Norway stands out with a remarkable long-term rise, moving steadily from outside the top ten in 2021 to a strong fifth place in 2025. Luxembourg, too, records a positive trajectory, illustrating how targeted improvements in economic competitiveness and social services can translate into broad gains in quality of life. The United Kingdom’s climb into sixth place also signals renewed strength in global mobility, healthcare access and overall wellbeing metrics.
Spain’s position, while lower than in the previous year, still reflects a high-quality lifestyle and strong fundamentals that keep it firmly within the top ten. Its ninth-place ranking shows that even in a competitive global environment, Spain remains one of the world’s most desirable places to live, offering an attractive blend of climate, culture, safety and healthcare. The slight drop can be seen as part of the natural ebb and flow of yearly performance rather than a structural decline.
Overall, the index shows a mature and competitive landscape in which the world’s top-quality-of-life countries continue to evolve rather than undergo dramatic shifts.
Northern Europe: The Nordic Model as a Global Benchmark

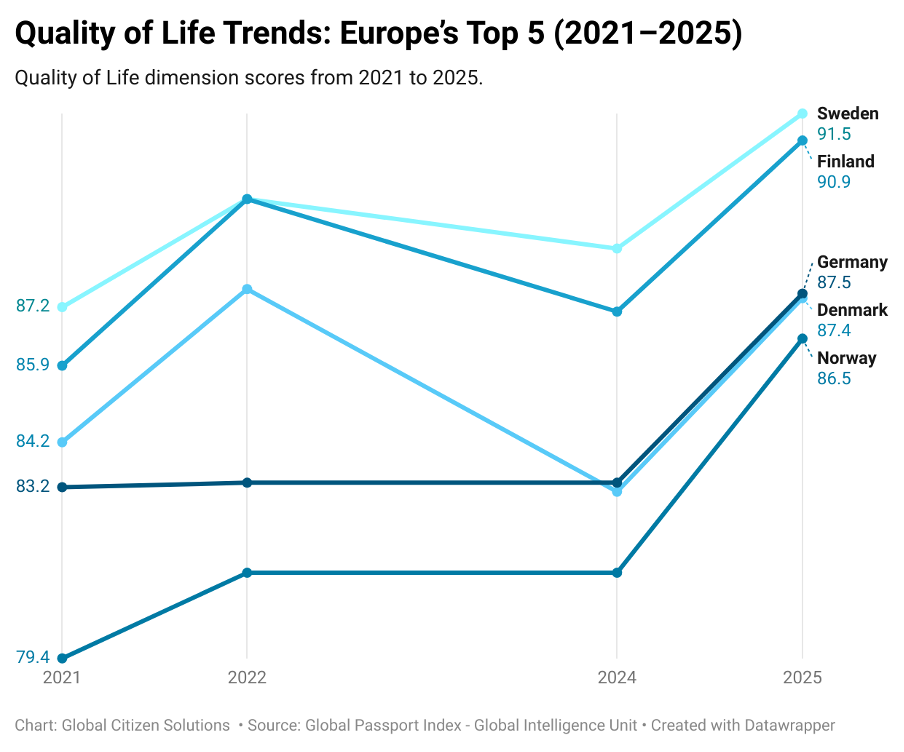
Northern Europe dominates the top of the ranking, with Sweden, Finland, Denmark, and Norway occupying four of the top five positions in 2025. These countries not only achieve the highest scores, but also demonstrate consistent upward trajectories over the past four years: Sweden rises from 87.2 in 2021 to 91.5 in 2025, Finland from 85.9 to 90.9, Denmark from 84.2 to 87.4, and Norway from 79.4 to 86.5. This pattern mirrors the findings of the World Happiness Report((Helliwell, J. F., Layard, R., Sachs, J. D., De Neve, J.-E., Aknin, L. B., & Wang, S. (Eds.). (2025). World Happiness Report 2025. Wellbeing Research Centre, University of Oxford. Retrieved from https://www.worldhappiness.report)), where the Nordic countries have ranked at the top for more than a decade, and corresponds closely with the UN Human Development Index((United Nations Development Programme. (2025). Human Development Report 2024/25. UNDP. Retrieved from https://report.hdr.undp.org/working-toward-AI-augmented-human-development )) and OECD Better Life Index((OECD. (2023). How’s Life? Measuring well-being 2023. Organisation for Economic Co-operation and Development. Retrieved from https://www.oecd.org/en/data/tools/well-being-data-monitor/current-well-being.html )), both of which place Northern Europe among the world’s highest performers across health, education, civic trust, and social protections((Helliwell, J. F., Layard, R., Sachs, J. D., De Neve, J.-E., Aknin, L. B., & Wang, S. (Eds.). (2024). World Happiness Report 2024. Wellbeing Research Centre, University of Oxford. Retrieved from https://worldhappiness.report)).
Researchers frequently attribute Nordic success to a combination of high institutional trust, low corruption, universal welfare systems, strong environmental policies, and consistently high levels of subjective wellbeing((Bergqvist, K., Yngwe, M. Å., & Lundberg, O. (2013). Understanding the role of welfare state characteristics for health and inequalities—An analytical review. BMC Public Health, 13, 1234. Retrieved from https://doi.org/10.1186/1471-2458-13-1234; Carlquist, E., Ulleberg, P., Delle Fave, A., Nafstad, H. E., & Blakar, R. M. (2017). Everyday understandings of happiness, good life, and satisfaction: Three different facets of well-being in the Nordic countries. International Journal of Wellbeing, 7(2), 30–56. Retrieved from https://doi.org/10.5502/ijw.v7i2.613 and Aslam, A., & Corrado, G. (2012). The determinants of happiness in the Nordic countries. International Monetary Fund Working Paper WP/12/93. Retrieved from https://www.imf.org/en/Publications/WP/Issues/2016/12/31/The-Determinants-of-Happiness-in-the-Nordic-Countries-25841)). These conditions reflect what Veenhoven describes as the interplay between the “liveability” of the environment and the “life-ability” of individuals, creating ecosystems where residents (and newcomers) can reliably flourish((Veenhoven, R. (2010). Happiness: Also known as “life satisfaction” and “subjective well-being.” In K. Land, A. Michalos, & M. Sirgy (Eds.), Handbook of social indicators and quality-of-life research (pp. 63–77). Springer.)).
However, Nordic nations also present important nuances that complicate idealized narratives. While they consistently score highly in international rankings due to strong welfare states, high social trust, and robust public services, researchers point to growing internal challenges such as rising income inequality and strains on welfare systems from demographic ageing((Sevä, I. J., & Kulin, J. (2018). Political trust and dissatisfaction: A comparison between the Nordic countries and the rest of Western Europe. Scandinavian Political Studies, 41(4), 239–260. Retrieved from https://doi.org/10.1111/1467-9477.12133; Halvorsen, R., & Stjernø, S. (Eds.). (2008). Working poor in Europe: A comparative approach. Edward Elgar and state (pp. 586–600). Oxford University Press.)). Additionally, the very features that support high well-being (such as progressive taxation and dense institutional structures) can generate political tensions or dissatisfaction among certain groups((Andersen, T. M., Holmström, B., Honkapohja, S., Korkman, S., Söderström, H. T., & Vartiainen, J. (2007). The Nordic model: Embracing globalization and sharing risks. Taloustieto Oy and Greve, B. (2020). The Nordic model and the modern world: Challenge or opportunity? Routledge.)). These nuances do not diminish the achievements of the Nordic model but underline that even the world’s highest-scoring countries face complex, evolving pressures that quality of life rankings only partially capture. Nonetheless, the region’s long-standing commitment to equality, social cohesion, and good governance continues to position the Nordic countries as inspiring examples of how societies can strive toward inclusive and sustainable well-being.
The Nordics, while not without their challenges, remain the clearest global example of how strong state capacity, deep social cohesion, and long-term commitments to sustainable development can reinforce one another to create consistently high-quality living environments.
Central Europe: Stability, Institutional Quality, and Incremental Gains
Central Europe’s representation in the top ten (Germany, the Netherlands, and Luxembourg) illustrates a different pattern: these countries do not exhibit the same dramatic increases as the Nordics but maintain consistently high scores that reflect long-standing institutional strength.
Germany represents one of the most stable pillars of European wellbeing, with its Quality of Life score rising from 83.2 in 2021 to 87.5 in 2025. Although Germany’s increase is gradual rather than dramatic, its consistency reflects the country’s deep institutional capacity, world-leading infrastructure, and robust performance in health, education, and governance. The Human Development Report routinely ranks Germany within the global top tier, citing high life expectancy, exceptional educational attainment, and strong economic capability((United Nations Development Programme. (2025). Human Development Report 2024/25. UNDP. Retrieved from https://report.hdr.undp.org/working-toward-AI-augmented-human-development)).
The OECD describes Germany as having one of the most comprehensive welfare states and strongest social insurance systems in the world, underpinned by high employment, strong vocational education, and high-quality public healthcare((OECD. (2023). How’s Life? Measuring well-being 2023. Organisation for Economic Co-operation and Development. Retrieved from https://www.oecd.org/en/data/tools/well-being-data-monitor/current-well-being.html)). This institutional architecture aligns with Sen’s capabilities framework, which emphasizes that wellbeing expands where individuals have stable freedoms supported by effective institutions((Sen, A. (1999). Development as freedom. Oxford University Press, (chapters 1–3, and chapter 5), pp. 8…)). Germany’s performance in the GPI thus mirrors its broader international profile: it is a country where governance reliability, social protections, and sustained investment in human development collectively elevate quality of life.
The Netherlands exhibits a similarly steady profile, with scores ranging from 82.1 in 2021 to 85.0 in 2025. The Dutch model blends strong democratic institutions, high happiness scores, and progressive social policies, producing an environment that consistently ranks among the world’s best.
The World Happiness Report frequently places the Netherlands within the global top ten, highlighting strong social trust, high-quality governance, and strong community networks((Helliwell, J. F., Layard, R., Sachs, J. D., De Neve, J.-E., Aknin, L. B., & Wang, S. (Eds.). (2024). World Happiness Report 2024. Wellbeing Research Centre, University of Oxford. Retrieved from https://worldhappiness.report)). Eurostat and OECD data identify the Netherlands as one of Europe’s top performers in environmental sustainability, healthcare accessibility, and work–life balance, areas that strongly influence subjective wellbeing. Dutch cities (Amsterdam, Utrecht, Rotterdam) regularly appear in Mercer’s Quality of Living Index due to safe urban environments, efficient public transport, and high levels of cultural and recreational amenities((Mercer. (2024). Quality of Living City Ranking 2024. Mercer. Retrieved from https://mobilityexchange.mercer.com/insights/quality-of-living-rankings)).
These factors collectively help explain why the Netherlands remains a stable high performer in the GPI: its social model produces not only material security but also high levels of life satisfaction, community trust, and environmental quality.
Luxembourg stands out as a particularly interesting case. As one of Europe’s smallest states, it undergoes one of the most notable improvements in the GPI Quality of Life ranking, rising from a score of 78.2 in 2021 to 84.9 in 2025. This significant upward movement corresponds with broader international assessments: Luxembourg consistently ranks among the world’s richest countries per capita, but its success in quality-of-life outcomes stems not only from income but from extensive public investment, high levels of safety, and one of Europe’s most efficient welfare systems((Eurostat. (2024). Quality of life indicators 2024. Publications Office of the European Union. Retrieved from https://ec.europa.eu/eurostat)). Its governance scores are among the highest in Europe, with exceptionally strong rule of law, political stability, and institutional effectiveness((Transparency International. (2024). Corruption Perceptions Index 2024. Transparency International. Retrieved from https://www.transparency.org/en/cpi/2024/index/lux )). Luxembourg also leads in digital governance and sustainable finance, reflecting its role as a global hub for green investment and European institutions((European Commission. (2025). Digital Economy and Society Index (DESI) 2025. Publications Office of the European Union. Retrieved from https://digital-strategy.ec.europa.eu/en/policies/2025-state-digital-decade-package)).
These developments support Veenhoven’s insight that quality of life emerges from the synergy between favorable living conditions and the opportunities available to individuals, a dynamic clearly visible in Luxembourg’s performance (Veenhoven, 2010)((Veenhoven, R. (2000). The four qualities of life: Ordering concepts and measures of the good life. Journal of Happiness Studies, 1(1), 1–39. https://doi.org/10.1023/A:1010072010360 )).
Collectively, Germany, the Netherlands, and Luxembourg demonstrate that Central Europe’s strength in the GPI Quality of Life dimension lies in durable institutional excellence rather than dramatic year-to-year change. Their high performance is anchored in predictable governance, effective welfare systems, strong human development outcomes, and consistently high levels of safety and environmental quality. While they do not match the Nordic countries’ rapid upward momentum, their stability (combined with incremental gains) creates environments in which residents and globally mobile individuals can depend on consistently high living standards, social protection, and opportunities for personal and professional flourishing. In the GPI, these traits translate into strong and enduring scores, ensuring Central Europe’s prominent place among the world’s best passports for living.
Together, these Central European countries form a “high plateau” of quality of life, stable, strong performers that benefit from robust institutions, low inequality, and high levels of trust in government, all of which align with Sen’s view that substantive freedoms and institutional reliability underpin expanding capabilities((Sen, A. (1999). Development as freedom. Oxford University Press, pp. 35-37.)).
The Anglosphere: The United Kingdom’s Stable, High-Level Performance
Among Anglosphere nations, only the United Kingdom appears in the top ten. Its 2025 score of 85.0 represents a modest but clear improvement since 2021, despite short-term volatility in governance, the consequences of Brexit and economic conditions((Dhingra, S., Ottaviano, G., Rappoport, V., Sampson, T., & Thomas, C. (2023). The impact of Brexit on UK trade and living standards. Centre for Economic Performance, London School of Economics. https://cep.lse.ac.uk; Office for Budget Responsibility (OBR). (2024). Brexit analysis: Forecasting assumptions and long-term productivity impacts. Office for Budget Responsibility. https://obr.uk/forecasts-in-depth/the-economy-forecast/brexit-analysis/ and Centre for Economic Performance (CEP). (2023). Brexit and consumer food prices: May 2023 update. London School of Economics and Political Science. https://cep.lse.ac.uk/pubs/download/brexit11.pdf)). Across OECD and Eurostat indicators, the UK continues to perform well in healthcare quality, higher education, cultural vibrancy, and personal freedoms, even as broader political debates over migration, public spending, and regional inequality remain prominent((OECD. (2024). OECD Better Life Index 2024. Organisation for Economic Co-operation and Development. Retrieved from https://www.oecdbetterlifeindex.org and Eurostat. (2024). Quality of life indicators 2024. Publications Office of the European Union. Retrieved from https://ec.europa.eu/eurostat)).
Brexit marked one of the most consequential political and economic transitions in modern British history, with measurable effects on governance, economic performance, mobility, social cohesion, and overall quality of life. Research from the London School of Economics, the UK Office for Budget Responsibility (OBR)((McCann, P. (2021). The UK regional economic impact of Brexit: Evidence and reflections. Papers in Regional Science, 100(4), 837–867. https://doi.org/10.1111/pirs.12642 and Office for Budget Responsibility (OBR). (2025). Fiscal risks and sustainability report 2025. Office for Budget Responsibility. https://obr.uk/frs/fiscal-risks-and-sustainability-july-2025/ )), the OECD, and Eurostat indicates that the immediate post-Brexit years brought a combination of economic frictions, political volatility, and uncertainty that temporarily weakened several aspects of the UK’s wellbeing profile((National Institute of Economic and Social Research (NIESR). (2023). Global economic outlook: Autumn 2023. NIESR. https://www.niesr.ac.uk/wp-content/uploads/2023/11/JC760-NIESR-Outlook-Autumn-2023-Global-Topical-Feature-v2.pdf)). The fall in business investment, disruptions in labor supply (particularly in sectors dependent on EU workers) slower trade flows, and inflationary pressures all contributed to a period of stagnation in living standards.
International mobility was also directly affected: UK passport holders lost extensive EU freedom-of-movement rights, reducing the mobility component of the British passport and contributing to a short-term decline in the country’s performance across global indices. However, since the initial post-Brexit adjustment, the UK’s passport ranking has remained relatively stable in the GPI from 2021 onward.
The UK’s continued presence among the global top ten demonstrates how deeply institutional resilience and long-term policy frameworks shape wellbeing. Even during periods of political uncertainty, its public services, legal protections, and social infrastructure remain sufficiently strong to sustain high levels of overall quality of life. This stability reflects a broader finding in comparative political economy: mature democracies with historically embedded welfare institutions tend to maintain strong wellbeing outcomes even amid disruptive social or economic cycles((Stiglitz, J. E., Sen, A., & Fitoussi, J.-P. (2010). Mismeasuring our lives: Why GDP doesn’t add up. The New Press.)).
UK’s closest neighbor, Ireland, reflects one of the most remarkable upward trajectories in Western Europe in the GPI. Its Quality of Life score increases from 80.9 in 2021 to 84.2 in 2025, securing a solid position in the 2025 top ten. Although Ireland ranks tenth, its rise is not a marginal achievement; rather, it represents a transformation driven by economic expansion, strong governance, and a distinctive social model that blends Anglo-European institutional features with a high quality of everyday life.
Ireland’s evolution within the GPI mirrors trends observed in international databases. The Human Development Report consistently ranks Ireland among the world’s top-tier performers, particularly in education and income indicators((United Nations Development Programme. (2025). Human Development Report 2024/25. UNDP. Retrieved from https://report.hdr.undp.org/working-toward-AI-augmented-human-development)). Since 2019, Ireland has appeared in the top ten globally for HDI, benefiting from rapid economic growth and unusually high levels of tertiary education attainment((United Nations Development Programme. (2025). Human Development Report 2024/25. UNDP. Retrieved from https://report.hdr.undp.org/working-toward-AI-augmented-human-development)). Eurostat data also highlight Ireland’s sustained improvements in life expectancy, digital infrastructure, and labor-market participation, helping reinforce its long-term upward trend in wellbeing outcomes((Eurostat. (2024). Quality of life indicators 2024. Publications Office of the European Union. Retrieved from https://ec.europa.eu/eurostat)).
Economically, Ireland has experienced one of the fastest growth trajectories in the OECD since the early 2010s. Even after adjusting for multinational profit-shifting (a statistical distortion frequently noted by the Central Statistics Office((Ireland’s economy looks unusually large on paper because many multinational companies (especially tech and pharma firms) book their profits there for tax reasons. This inflates GDP and other national economic indicators, making the country appear richer than it actually is. To get a more realistic picture of Irish living standards, economists adjust the data to remove this artificial inflation. Ireland’s Central Statistics Office (CSO) even created special measures (like Modified Gross National Income (GNI))to correct for profit-shifting.))) indicators of household income, employment, and consumption reveal structural improvements in living standards((Data for Ireland’s economic performance and adjusted national-accounts indicators were obtained from the Central Statistics Office, including Annual National Accounts 2024: GNI* and De-globalised Results (Central Statistics Office, 2024a), Annual National Accounts 2024: Key Findings (Central Statistics Office, 2024b), Annual National Accounts 2023: GNI* Tables and Methodology (Central Statistics Office, 2023a), Modified Gross National Income (GNI*) Explained (Central Statistics Office, 2024c), and the Household Income and Living Conditions (SILC) 2023 report (Central Statistics Office, 2023b). Additional comparative data were drawn from the OECD’s Economic Outlook 2024: Ireland Country Report (OECD, 2024a), Distribution of Household Income, Consumption and Saving in Line with National Accounts (OECD, 2023), and the OECD Gross National Income (GNI) – Ireland indicator (OECD, 2024b).
URLs: https://www.cso.ie/en/releasesandpublications/ep/p-ana/annualnationalaccounts2024/gniandde-globalisedresults/; https://www.cso.ie/en/releasesandpublications/ep/p-ana/annualnationalaccounts2024/keyfindings/; https://www.cso.ie/en/releasesandpublications/ep/p-ana/annualnationalaccounts2023/gniandde-globalisedresults/; https://www.cso.ie/en/interactivezone/statisticsexplained/nationalaccountsexplained/modifiedgni/; https://www.cso.ie/en/releasesandpublications/ep/p-silc/surveyonincomeandlivingconditionssilc2023/keyfindings/; https://www.oecd.org/economy/ireland-economic-snapshot/; https://www.oecd.org/en/publications/distribution-of-household-income-consumption-and-saving-in-line-with-national-accounts_615c9eec-en.html; https://data.oecd.org/natincome/gross-national-income.htm)). The country’s economic performance, combined with strong public finances and a favourable business environment, has created conditions that support high levels of material wellbeing and enhance its performance in the Quality of Life dimension of the GPI.
Institutional resilience has also played a key role. Ireland’s governance profile is consistently strong, with high rule-of-law scores, stable democratic institutions, and relatively low corruption levels compared to many EU peers((Transparency International. (2023). Corruption Perceptions Index 2023. Transparency International. Retrieved from https://www.transparency.org/en/cpi/2023 )). These governance attributes contribute to the “institutional livability” that Veenhoven((Veenhoven, R. (2000). The four qualities of life: Ordering concepts and measures of the good life. Journal of Happiness Studies, 1(1), 1–39. https://doi.org/10.1023/A:1010072010360)) and Sen((Sen, A. (1999). Development as freedom. Oxford University Press, pp. 35-37.)) identify as foundational to wellbeing: individuals can better realize their capabilities in environments where legal and political institutions function predictably and effectively.
Socially, Ireland has undergone significant liberalisation over the past decade, strengthening rights and freedoms that directly affect quality-of-life indicators. The expansion of civil liberties (highlighted in the legalisation of same-sex marriage and reproductive rights) has increased Ireland’s standing in democracy and rights indices. At the same time, Ireland maintains a strong sense of community and high social-support scores, factors that heavily influence subjective wellbeing metrics in the World Happiness Report((Helliwell, J. F., Layard, R., Sachs, J. D., De Neve, J.-E., Aknin, L. B., & Wang, S. (Eds.). (2024). World Happiness Report 2024. Wellbeing Research Centre, University of Oxford. Retrieved from https://worldhappiness.report )).
Ireland’s cities (particularly Dublin, Cork, and Galway) have gained visibility in global quality-of-living surveys. Mercer’s Quality of Living Index consistently places Dublin as one of the most livable cities for expatriates due to its safety, cultural life, education standards, and increasingly modern infrastructure((Mercer. (2024). Quality of Living City Ranking 2024. Mercer. Retrieved from https://mobilityexchange.mercer.com/insights/quality-of-living-rankings)). These factors help explain Ireland’s attractiveness for global professionals, investors, and remote workers.
Ireland’s rise in the GPI Quality of Life dimension is also tied to its success as a destination for globally mobile individuals. Over the past decade, Ireland has become a hub for multinational talent, particularly in technology, pharmaceuticals, and financial services. Its immigration framework, though more restrictive than some continental European systems, offers clear pathways for skilled workers and entrepreneurs. The combination of strong labor demand, high-quality public services, and English-language accessibility positions Ireland as an appealing destination within the European context.
Its trajectory suggests that Ireland is likely to remain a leading quality-of-life performer in future editions of the GPI. It exemplifies how a small state can leverage institutional stability, progressive social reforms, and knowledge-based economic growth to produce an environment that supports high levels of wellbeing for residents and internationally mobile individuals alike.
Southern Europe: Spain as the Region’s Sole Representative

Spain’s position in the 2025 GPI (ninth in the Quality-of-Life dimension with a score of 84.8) stands out not only as evidence of its consistently strong wellbeing profile, but also as a structural anomaly within Southern Europe. As the only country from the region to appear in the top ten, Spain distinguishes itself through a multidimensional combination of human development outcomes, institutional performance, health and longevity, environmental advantages, and cost-of-living. Its scores have risen steadily over the past four years, from 81.5 in 2021 to 84.8 in 2025, indicating stability and resilience in the face of broader European socioeconomic turbulence.
Spain’s position reflects strengths in domains that international organizations repeatedly identify as core determinants of wellbeing. The OECD((OECD. (2024). OECD Better Life Index 2024. Organisation for Economic Co-operation and Development. Retrieved from https://www.oecdbetterlifeindex.org )) and the World Bank((World Bank. (2024). World Development Indicators 2024. World Bank Group. Retrieved from https://datatopics.worldbank.org/world-development-indicators )) note that Spain has one of the highest life expectancies in the world (often surpassing 83 years) driven by a combination of diet, healthcare access, community cohesion, and climate((Global Citizen Solutions. (2025, November 7). Extending the Blue Zone model: New destinations for quality of life and sustainable mobility [Briefing]. Global Citizen Solutions. https://www.globalcitizensolutions.com/briefing/blue-zone-model/ )).
Spain’s healthcare system consistently ranks among the most efficient and effective globally, with universal access, strong primary care networks, and high public trust. According to the Commonwealth Fund’s international comparisons, Spain outperforms many higher-income countries across preventable mortality, care coordination, and affordability, all central metrics in broader wellbeing frameworks((Commonwealth Fund. (2024). International health care system profiles. The Commonwealth Fund. Retrieved from https://www.commonwealthfund.org/international-health-policy-center/system-profiles )). This robust healthcare foundation contributes significantly to Quality of Life indicators, particularly those tied to long-term health security and ageing.
Environmental and climatic advantages further reinforce Spain’s wellbeing profile. Its Mediterranean climate, with high sunlight exposure and mild winters, especially in the south, has documented effects on subjective wellbeing and mental health, including reduced stress levels, lower rates of seasonal depression, and improved opportunities for outdoor activity((Kämpfer, S., & Mutz, M. (2013). On the sunny side of life: Sunshine duration and life satisfaction. Journal of Happiness Studies, 14(3), 859–878. https://doi.org/10.1007/s10902-012-9363-8 and World Bank. (2024). World development indicators 2024. World Bank Group.)). These factors correlate strongly with life satisfaction metrics in the World Happiness Report and Eurobarometer surveys, where Spain consistently performs above the EU average in reported quality of life, social connection, and perceived health.
Spain’s strong performance in the Quality of Life dimension of the GPI is reinforced by the consistently high rankings of its major cities within Europe. According to the Quality of Life in European Cities 2023 report((European Commission. (2023). Quality of life in European cities 2023. Publications Office of the European Union. Retrieved from https://ec.europa.eu/regional_policy/sources/reports/qol2023/2023_quality_life_european_cities_en.pdf )), cities such as Oviedo, Málaga, Madrid, and Barcelona perform above the Southern European average and often match or surpass cities in Northern and Western Europe in areas like safety, inclusiveness, cultural amenities, mobility, and access to public services. Oviedo ranks among the safest cities in Europe, while Madrid and Barcelona sit within the top group for satisfaction with cultural facilities and public transport. Málaga and Oviedo also stand out as exceptionally age-friendly cities, achieving satisfaction levels comparable to top performers in Central and Northern Europe. These consistently strong urban outcomes highlight Spain’s distinctive ability to combine Mediterranean lifestyle benefits with robust infrastructure, social cohesion, and high-quality public services, key factors driving its competitive position in the GPI’s Quality of Life pillar.
Where Spain truly differentiates itself from other Southern European nations is in governance and institutional quality. While Mediterranean countries broadly share strong social cohesion and high life satisfaction, Spain performs comparatively better in several structural domains: SDG progress, digital governance, public administration capacity, and renewable energy transitions. The European Commission’s progress reports consistently position Spain ahead of other Southern European states in digital infrastructure, e-government services, and renewable energy adoption, particularly in wind and solar capacity, where Spain is among Europe’s top performers((European Commission. (2024, July). Spain 2024 Digital Decade Country Report. Shaping Europe’s digital future. Retrieved from https://digital-strategy.ec.europa.eu/en/factpages/spain-2024-digital-decade-country-report )).
Economically, Spain combines a diversified economy with moderate cost-of-living conditions relative to Northern Europe, a combination that enhances both affordability and subjective wellbeing, although inflationary pressures and housing affordability challenges persist in certain tensioned urban zones. Still, while many high-income Northern European countries face high housing and consumer costs, Spain offers better affordability while preserving strong public services, making it particularly attractive to expatriates, digital nomads, and retirees.
In this sense, Spain represents a unique hybrid: a Southern European society with lifestyle benefits that enhance wellbeing, combined with institutional and developmental strengths that underpin long-term life quality. Its consistent performance from 2021 to 2025, as captured by the GPI, confirms Spain’s status as a Southern European outlier, and one of the most attractive destinations globally for internationally mobile individuals seeking a high standard of living, environmental comfort, and social security.
A Europe that Leads in Wellbeing, with Regional Pathways to the Top
The 2025 Quality of Life rankings reveal not a homogenized European success story, but a differentiated one. Northern Europe leads through a deeply institutionalized model of social democracy and environmental stewardship; Central Europe demonstrates stable excellence rooted in governance and economic diversification; the United Kingdom reflects the resilience of the Anglosphere’s welfare-state tradition; and Spain stands alone in Southern Europe, showing how Mediterranean lifestyle, strong healthcare, and institutional capacity can converge to produce top-tier quality of life.
Across regions, the common message is clear: high quality of life is consistently associated with strong institutions, sustainable development, high social trust, effective public services, and environments in which individuals possess the capabilities to lead meaningful, autonomous, and flourishing lives.
For readers interested in exploring the full set of indicators, country scores, and underlying methodology behind the Quality of Life dimension of the GPI, the complete and interactive Quality of Life Index is available online at Global Citizen Solutions. It includes the latest comparative data on human development, cost of living, safety, governance, freedoms, environmental performance, happiness, and migrant acceptance across more than 180 countries. You can access the full Quality of Life dimension of the GPI here.
While Europe dominates the global top ten, every continent has at least one country that stands out as a regional benchmark for living well. These regional leaders are not simply the richest or the most mobile; they are countries where strong institutions, human development, freedoms, and environmental conditions converge to support a life that is safe, meaningful, and sustainable. The Quality of Life Index itself is explicitly multidimensional, blending Sustainable Development Goal performance, cost of living, civil and political freedoms, happiness, environmental quality, and migrant acceptance into a single composite score designed with expats, global investors, remote workers, and internationally mobile families in mind.
Europe
In Europe, Sweden epitomizes this holistic understanding of the “good life.” By 2025, it not only leads the continent but also tops the global Quality of Life rankings, with a score above 91 and a clear upward trajectory since 2021.
Sweden’s performance rests on a long-standing social-democratic model that fuses universal welfare provision, high-quality public education, and robust healthcare with low corruption and strong rule of law. Its high Human Development Index, strong SDG performance, and consistently strong showing in the World Happiness Report all point in the same direction: this is a society that has invested for decades in both people and institutions. The environmental dimension is equally critical. Sweden’s ambitious climate policies, extensive renewable-energy deployment, and emphasis on green urbanism echo Veenhoven’s argument that the “liveability” of the environment is a core component of quality of life, not an optional extra. When global citizens choose Sweden, they are not only buying into personal safety and generous public services but also into a social contract where equality, sustainability, and trust are central to everyday life.
The Americas
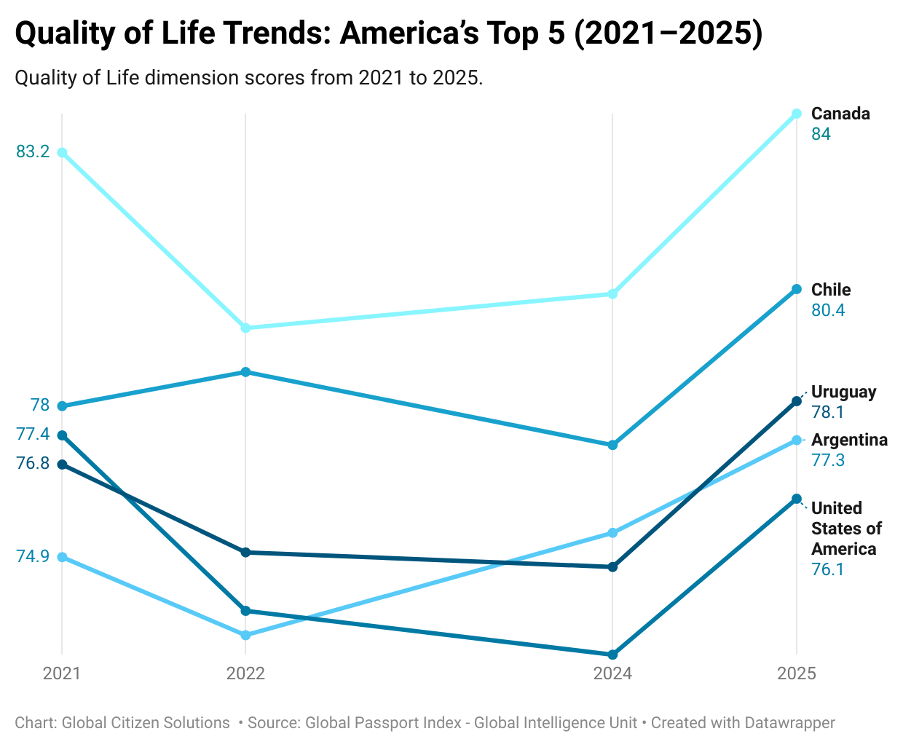
In the Americas, Canada occupies a similar symbolic position. It is not the region’s largest economy, nor the only country with high human development, but it is the one that most consistently combines prosperity, freedom, and openness into a coherent quality-of-life package. Canada’s score in the mid-80s reflects very high human development, with strong health and education outcomes, alongside a robust framework of civil liberties and political rights. Its immigration model (—points-based, relatively transparent, and explicitly designed to attract skilled workers and investors) —translates into high migrant-acceptance scores and a multicultural social fabric that many expats experience as welcoming. At the same time, Canada’s housing crises in cities such as Vancouver and Toronto, and rising living costs more generally, serve as reminders that even high performers face trade-offs. For globally mobile individuals, Canada’s appeal lies in this balance: a liberal democracy with world-class public services and natural environments, but also a society grappling openly with questions of affordability, urbanisation, and inclusion.
Between 2021 and 2025, Chile, Uruguay, and Argentina display distinct quality-of-life trajectories marked by an initial decline followed by varying degrees of recovery. Chile records the strongest overall performance, rising from 78.0 in 2021 to 80.4 in 2025, despite a temporary setback in 2024, indicating comparatively higher resilience and recovery capacity. Uruguay follows a more moderate but stable path, declining from 76.8 in 2021 to 74.9 in 2022 before recovering steadily to 78.1 by 2025, reflecting incremental improvements rather than rapid rebounds. Argentina exhibits a similar pattern of mid-period decline and subsequent recovery, falling from 74.9 in 2021 to a low in 2022, then improving consistently to reach 77.3 in 2025. While all three countries converge toward improved quality-of-life outcomes by the end of the period, Chile’s stronger rebound and higher final score distinguish it from Uruguay and Argentina, whose gains, though positive, remain more gradual and structurally constrained.

The United States displays a more volatile quality-of-life trajectory over the 2021–2025 period, with a pronounced decline followed by a partial recovery. After starting at 77.4 in 2021, the score decreases sharply to 73.8 in 2022 and reaches a low point in 2024, before rebounding to 76.1 in 2025. Despite this late-period improvement, the United States does not return to its 2021 level by the end of the period, indicating a slower and less complete recovery relative to several regional peers. The observed volatility suggests heightened sensitivity to short-term disruptions and uneven progress across quality-of-life dimensions, resulting in a comparatively weaker overall performance by 2025 when assessed against higher-performing countries in the Americas.
Asia
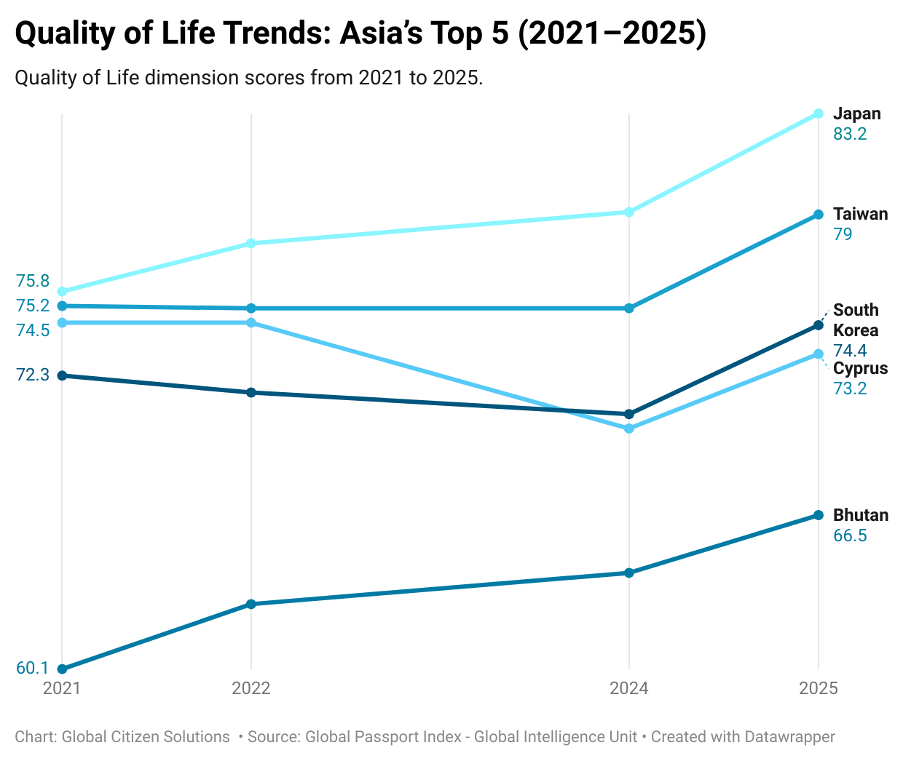
In Asia, Japan emerges as the regional reference point for quality of life, even as it confronts deep structural challenges such as demographic ageing and slow growth. Japan’s Quality of Life score in the low-80s arises from a combination of outstanding infrastructure, efficient and accessible healthcare, excellent public transport, and some of the safest urban environments in the world. High life expectancy, low crime rates, and a strong culture of public order shape a distinctive version of wellbeing in which stability is a central value. For many expats and internationally mobile professionals, Japan’s appeal is precisely this sense of order and predictability: trains run on time, cities function, and basic services are reliable. At the same time, Japan’s social model (—long working hours, high social expectations, and relatively limited immigration) —illustrates how quality of life is never one-dimensional. It offers a very high standard of living and personal security but less in the way of the lifestyle flexibility and diversity found in some Western societies. The Quality of Life Index captures this tension by rewarding Japan’s strengths in safety, infrastructure, health, and education while reflecting more modest scores in migrant acceptance and cost-of-living dynamics.
Excluding Japan, the remaining countries in Asia’s top five, Taiwan, South Korea, Cyprus, and Bhutan, exhibit heterogeneous quality-of-life trajectories between 2021 and 2025, reflecting differing levels of stability and recovery capacity.
Taiwan demonstrates a relatively stable performance over most of the period, maintaining a score of approximately 75 between 2021 and 2024 before recording a marked improvement to 79.0 in 2025, suggesting late-period gains rather than continuous growth.
South Korea follows a pattern of gradual decline from 72.3 in 2021 to a low point in 2024, followed by a recovery to 74.4 in 2025, indicating moderate volatility and partial rebound. Cyprus shows a more pronounced mid-period deterioration, declining from 74.5 in 2021 to its lowest level in 2024, before recovering to 73.2 in 2025; despite this improvement, its 2025 score remains below its initial 2021 level. Bhutan, while consistently recording the lowest scores among this group, displays a steady upward trend from 60.1 in 2021 to 66.5 in 2025, reflecting sustained progress from a lower baseline.
Taken together, these trajectories point to divergent recovery paths across the region, with Taiwan exhibiting the strongest late-period performance among the non-leading countries, while South Korea, Cyprus, and Bhutan demonstrate more incremental and uneven improvements.
Africa
Across Africa, Quality of Life scores reveal a landscape marked by divergence, where a handful of countries distinguish themselves through long-term improvements in governance, stability, and service provision. While the region as a whole does not match the performance of Western Europe or the Nordic states, several African nations have carved out strong regional positions and are steadily strengthening the lifestyle and mobility appeal of their passports. The data from 2022 to 2025 makes this clear: Africa’s highest performers are those that have invested consistently in stability, institutional strength, and an outward-facing economic model.
Mauritius remains the continent’s undisputed leader. Its Quality of Life scores show a steady upward trajectory (65.7 to 70.4 to 69.2, reaching 73.0 in 2025) positioning it comfortably ahead of its African peers ranking 45th. Mauritius’s advantage stems from a combination of good governance, strong human-development outcomes, relative safety, and a diversified services economy centered on finance and tourism. Over the years, the country has deliberately differentiated itself from the structural volatility of the region, cultivating a stable democratic system and an investor-friendly regulatory environment. Its growing infrastructure, high-quality private healthcare, and expanding international education sector reinforce its status as Africa’s most lifestyle-attractive mobility option. Among African passports, Mauritius’s stands out as the one most aligned with global competitiveness in Quality of Life.
Cabo Verde, ranked 77th in the Quality of Life dimension, follows with a consistent upward trend, recovering from earlier plateaus and rising from 58.2 to 65.8 across the four-year period. Its progress reflects steady improvements in governance, public service delivery, and security perceptions. Although it does not match Mauritius’s performance, Cabo Verde has significantly strengthened its regional standing. Its gradual but sustained improvement makes it increasingly attractive for lifestyle-driven mobility, especially within West Africa and the Lusophone world. The country’s trajectory signals a strengthening national value proposition built on stability and public-sector reform.
Namibia also demonstrates reliable, incremental progress, moving from 59.1 to 64.9 between 2021 and 2025. Its evolution is driven by gains in safety, environmental quality, and cost-of-living advantages, combined with relatively dependable governance. Namibia’s performance remains mid-tier global, but its consistency gives the Namibian passport a growing level of credibility for individuals prioritizing stability and long-term predictability. While not a dramatic rise, Namibia’s steady upward movement underscores the benefits of sustained institutional progress and position the country in the 85th position in the Quality of Life dimension of the GPI.
Ghana presents a pattern of stability with minor fluctuations, maintaining scores between 62.7 and 64.0 across the assessment period and ranking 91st. The rebound to 64.0 in 2025 reinforces the resilience of its governance and human-development profile. Ghana does not show the strong upward momentum of Mauritius or Cabo Verde, but it remains one of the region’s most consistently performing states. This stability supports a dependable mobility profile, making the Ghanaian passport a solid, if not rapidly improving, option.
South Africa rounds out the group with modest but meaningful increases (from 61.3 to 63.8) supported by strong national infrastructure, advanced healthcare systems, and considerable economic scale. Despite ongoing security challenges that temper its overall score, South Africa retains one of the most competitive lifestyle profiles on the continent. Its improvements, although gradual, show that strong structural foundations continue to support incremental gains in Quality of Life, ranking 93rd among all counties analyzed.
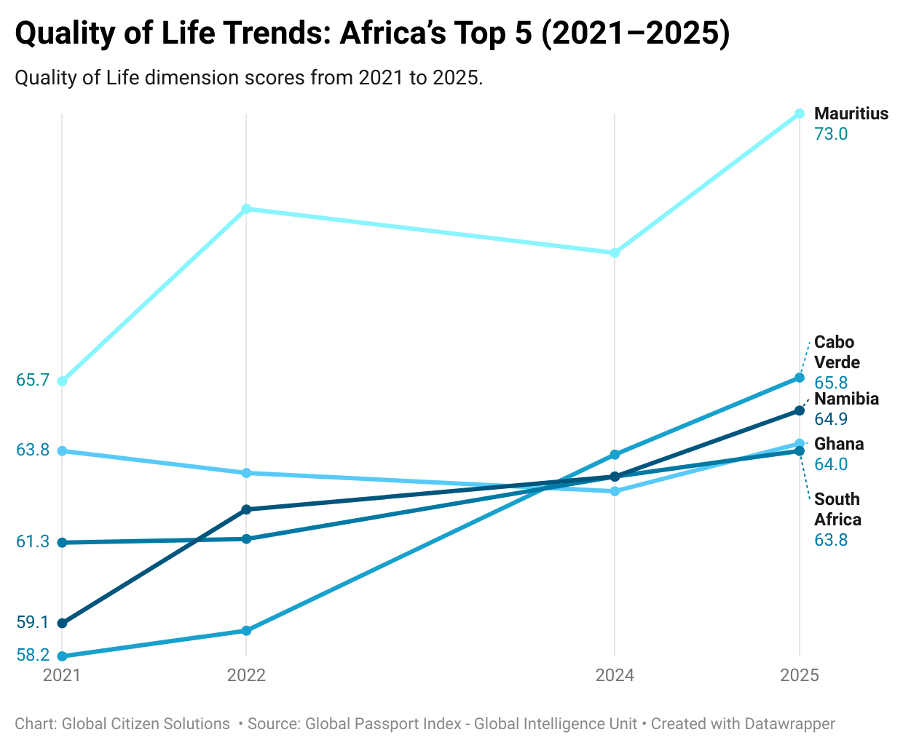
Taken together, these trajectories show a continent shaped by divergence but also by clear leaders. Mauritius sits at the top, offering the strongest combination of stability, services, and lifestyle attractiveness. Cabo Verde, Namibia, and Ghana form a cluster of steady, reliable performers, each strengthening its position gradually. South Africa continues to leverage its structural advantages despite persistent challenges. These trends underline a broader pattern: in Africa, the most competitive passports are those backed by sustained improvements in governance, stability, and service quality, factors that continue to shape global mobility in decisive ways.
Oceania
Oceania’s mobility and quality-of-life landscape is shaped by a sharp divide between two global leaders (New Zealand and Australia) and a group of small island states that show mixed but often improving performance. The region contains some of the world’s highest-scoring passports, driven by strong governance, environmental stability, and robust economic indicators. At the same time, smaller Pacific nations like Tuvalu, Palau, and Nauru experience pronounced year-to-year volatility, reflecting structural vulnerabilities and limited institutional capacity. Together, these dynamics illustrate how geography, size, and state capacity shape mobility outcomes in Oceania.
New Zealand stands out as the region’s benchmark performer. Its Quality of Life score rises from 82.6 to 83.7 over the period, maintaining one of the strongest lifestyle profiles globally and positioning the country in the 12th position in the Quality of Life dimension of the GPI. The nation continues to improve across economic strength, governance, and environmental stability, reinforcing its position as a top-tier passport not only in Oceania but worldwide. New Zealand’s consistent upward trajectory also strengthens its ranking performance, climbing from 22nd to 10th. The combination of high human-development outcomes, strong institutions, and a stable social model continues to make it the region’s undisputed leader.
Australia, ranked 19th, follows closely with a similarly impressive profile. Although slightly below New Zealand in Quality of Life (rising from 78.9 to 81.9) Australia performs strongly across all categories and maintains excellent global competitiveness. Its economic strength remains exceptionally high, while environmental and quality-of-life scores stay stable despite minor cyclical fluctuations. Australia’s ranking shifts between 27th and 19th across the four-year window, reflecting global competition among high-performing states rather than domestic decline. Together, New Zealand and Australia form a clear upper tier in Oceania, both offering some of the world’s most desirable mobility and residency conditions.
Beyond the two giants, the picture becomes more varied. Tuvalu presents one of the most compelling improvement stories in the Pacific. Its Quality of Life score increases significantly from 68.9 to 72.7, and its economic indicators show meaningful recovery after earlier declines. Tuvalu’s 2025 score positions it as one of the strongest small-state performers in the region. However, its Quality of Life ranking remains stable in the 41st, largely because structural constraints limit its ability to translate gains into sustained competitiveness. Even so, the upward momentum suggests resilience and the gradual strengthening of its mobility profile.
Palau and Nauru follow a distinct trajectory in Oceania, countries with small populations and constrained economic bases, yet surprisingly strong Quality of Life performance. Both show meaningful improvements: Palau’s Quality of Life rises from 68.9 to 72.6, while Nauru’s increases from 65.7 to 72.6, placing them in a comparatively strong position despite their structural limitations. Their overall rankings, hovering between 48th and 49th, reinforce that these states perform well within the global context, especially given their scale. However, their narrow economic foundations and limited resources still generate volatility in other indicators, which can restrict rapid upward movement. Even so, their ability to maintain good rankings and steadily rising living-standard scores highlights a level of resilience uncommon among microstates.
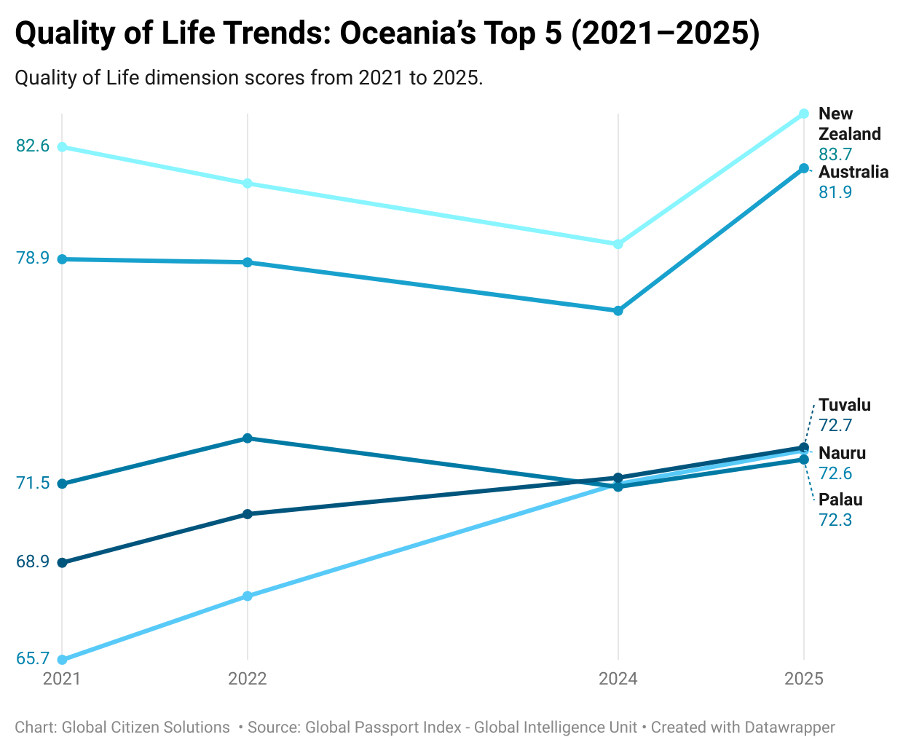
These five Oceania states illustrate the region’s dual reality. New Zealand and Australia perform at consistently world-class levels, with strong upward trajectories that reinforce their status among the most desirable passports globally. Tuvalu and Palau demonstrate meaningful improvement and growing resilience, while Nauru continues to face developmental constraints despite isolated gains. Oceania’s top performers succeed because of strong institutions, high human development, and long-term stability, while its smaller states offer varied but increasingly dynamic mobility profiles shaped by governance reforms and environmental pressures.
Taken together, regional leaders show that quality of life is not the monopoly of any single model of development. Sweden’s universalistic welfare state, Canada’s liberal multiculturalism, Japan’s ordered stability, Mauritius’s niche hub strategy, and New Zealand’s nature-centric social democracy are very different pathways to high wellbeing, but all share certain underlying characteristics: reasonably effective and predictable institutions, investments in health and education, a commitment—at least in principle—to environmental sustainability, and a minimum level of openness to the outside world. For globally mobile individuals, the Quality of Life pillar of the Global Passport Index is less about finding a single “best” country and more about identifying which regional archetype aligns with their own preferences, values, and constraints. A young tech professional may gravitate towards Japan’s high-tech urbanism; a family seeking safety and public schools might prioritise Sweden or Canada; a retiree looking for a warm-climate base with relative stability may consider Mauritius or New Zealand.
The deeper message of the Index is that quality of life is relational and contextual. Each of these regional champions demonstrates that what counts as a “good life” is not simply a matter of income or mobility, but of how societies organize security, opportunity, community, and the environment into coherent life chances for their residents and newcomers alike.

While several countries continue to make incremental progress toward sustainable development goals, a significant group is moving in the opposite direction, experiencing multidimensional declines that cut across economic stability, democratic governance, environmental resilience, personal well-being, and social cohesion.
When examined collectively, these trends reveal a challenging pattern: in many parts of the world, institutional capacity is diminishing precisely when populations face intensifying social, economic, and climatic stressors. This analysis, grounded in recent global indicators and country-level data, examines the nations with the most pronounced declines, illustrating how economic volatility, governance crises, environmental degradation, and rising insecurity converge to undermine national stability and citizen well-being.
173th – Pakistan (↓ 20 positions)
Pakistan offers a striking example of how macroeconomic instability can ripple across all dimensions of well-being. With inflation averaging 23% in 2023–2024 and food inflation topping 40%, everyday life has become increasingly unaffordable for millions (World Bank, 2024)((World Bank. (2024). Pakistan development update: Navigating economic instability. World Bank Group. https://www.worldbank.org and World Bank. (2024). International debt statistics 2024. World Bank Group. https://www.worldbank.org. )). The rupee’s nearly 40% depreciation against the U.S. dollar eroded purchasing power, while external debt surpassed $131 billion, tightening fiscal space. Simultaneously, democratic freedoms weakened (reflected in a Freedom House score of 37/100) amid growing repression of journalists and civil society((Freedom House. (2025). Freedom in the world 2025: Pakistan. Retrieved from: https://freedomhouse.org/sites/default/files/2025-02/FITW_World_2025_Feb.2025.pdf)). Environmental conditions compound the situation: PM2.5 pollution levels routinely exceed WHO recommendations by six to seven times, and Lahore often ranks as the world’s most polluted urban area((World Health Organization. (2021). WHO global air quality guidelines: Particulate matter (PM2.5 and PM10), ozone, nitrogen dioxide, sulfur dioxide and carbon monoxide. WHO. https://www.who.int)). These overlapping pressures contribute to Pakistan’s stagnation within the SDG Index, where it ranks 125 of 166 countries((Sachs, J. D., Lafortune, G., Kroll, C., Fuller, G., & Woelm, F. (2024). Sustainable development report 2024: Financing the SDGs. Sustainable Development Solutions Network. https://www.sdgindex.org)).
169th Niger (↓ 21 positions)
Political instability is a central driver of decline in Niger, where the 2023 military coup dismantled democratic institutions and resulted in a sharp governance regression. Freedom House rated the country 14/100 after the suspension of constitutional order((Freedom House. (2025). Freedom in the world 2025: Niger. Retrieved from: https://freedomhouse.org/sites/default/files/2025-02/FITW_World_2025_Feb.2025.pdf )), while more than $500 million in international aid was frozen by the EU, ECOWAS, and the World Bank((World Bank. (2023). World Bank Group statement on Niger. World Bank Group. https://www.worldbank.org)). The consequences have been acute: over 4.3 million people now face food insecurity, and the country sits near the bottom of the SDG Index at 163/166((Food and Agriculture Organization of the United Nations. (2024). Global report on food crises 2024. FAO, WFP, UNICEF. https://www.fao.org )). Climate vulnerability (Niger’s temperatures are rising 1.5 times faster than the global average) exacerbates challenges in agriculture, livelihoods, and water security, deepening the population’s fragility((World Meteorological Organization. (2023). State of the climate in Africa 2023. WMO. https://public.wmo.int and Sachs, J. D., Lafortune, G., Kroll, C., Fuller, G., & Woelm, F. (2024). Sustainable development report 2024: Financing the SDGs. Sustainable Development Solutions Network. https://www.sdgindex.org)).
138th Azerbaijan (↓ 22 positions)
Azerbaijan’s trajectory is shaped by persistent governance constraints, economic dependence, and environmental pressure. Freedom House assigns the country one of the lowest scores globally at 7/100((Freedom House. (2025). Freedom in the world 2025: Azerbaijan. Freedom House. Retrieved from: https://freedomhouse.org/sites/default/files/2025-02/FITW_World_2025_Feb.2025.pdf )), citing severe limits on political participation and expression. Its economy remains heavily reliant on hydrocarbons, which constitute over 90% of exports; this makes it acutely sensitive to volatility in global energy markets((International Energy Agency. (2023). Azerbaijan energy profile. IEA. https://www.iea.org)). Meanwhile, inequality between Baku and rural regions continues to widen. Environmental performance remains weak (the country ranks 96/180 in the Environmental Performance Index) due to air pollution, weak biodiversity protections, and soil degradation((Sachs, J. D., Lafortune, G., Kroll, C., Fuller, G., & Woelm, F. (2024). Sustainable development report 2024: Financing the SDGs. Sustainable Development Solutions Network. https://www.sdgindex.org and Yale Center for Environmental Law & Policy. (2022). Environmental performance index 2022. Yale University. https://epi.yale.edu)). Regional tensions following the 2023 events in Nagorno-Karabakh further dampen public trust, well-being, and social cohesion.
185th Myanmar (↓ 23 positions)
Few countries have experienced a decline as severe or multifaceted as Myanmar’s. Since the 2021 military coup, the country’s Freedom House rating has collapsed to 5/100 amid escalating conflict, mass arrests, and widespread human-rights violations((Freedom House. (2025). Freedom in the world 2025: Myanmar. Retrieved from: https://freedomhouse.org/sites/default/files/2025-02/FITW_World_2025_Feb.2025.pdf)). Internal displacement has reached 2.7 million people, according to the UN, reflecting systemic violence across several regions((United Nations High Commissioner for Refugees. (2024). Myanmar emergency. UNHCR. https://www.unhcr.org)). Inflation has surged above 30%, and GDP per capita now sits more than 13% below pre-coup levels((World Bank. (2024). Myanmar economic monitor: Navigating uncertainty. World Bank Group. https://www.worldbank.org)). Environmental indicators mirror this downward trajectory: Myanmar loses an estimated 300,000 hectares of forest each year, one of the highest rates in Southeast Asia((Food and Agriculture Organization of the United Nations. (2023). Global forest resources assessment 2023: Asia. FAO. https://www.fao.org and Secretariado Ejecutivo del Sistema Nacional de Seguridad Pública. (2024). Incidencia delictiva del fuero común. Government of Mexico. https://www.gob.mx)). With its SDG progress effectively stalled, the country stands as one of the world’s most profound governance and development failures.
81st Mexico (↓ 24 positions)
Mexico’s decline is shaped by persistent security challenges, institutional weaknesses, and environmental pressures. Despite macroeconomic stability, the country recorded more than 30,000 homicides in 2024 (one of the world’s highest totals outside active war zones) while surveys reveal that only 27% of residents feel safe walking in their neighborhoods at night((Instituto Nacional de Estadística y Geografía. (2024). Encuesta nacional de seguridad pública urbana (ENSU). INEGI. https://www.inegi.org.mx )). Journalists continue to face extreme risks, with more than 150 killed since 2000, contributing to Mexico’s Freedom House score of 60/100((Freedom House. (2025). Freedom in the world 2025: Mexico. Freedom House. Retrieved from: https://freedomhouse.org/sites/default/files/2025-02/FITW_World_2025_Feb.2025.pdf)). Rising living costs, including 4.4% inflation in 2024((World Bank. (2024). Mexico macro poverty outlook. World Bank Group. https://www.worldbank.org)), strain household budgets, while water shortages, pollution, and climate extremes undermine environmental resilience((Sachs, J. D., Lafortune, G., Kroll, C., Fuller, G., & Woelm, F. (2024). Sustainable development report 2024: Financing the SDGs. Sustainable Development Solutions Network. https://www.sdgindex.org )). These dynamics have stalled Mexico’s SDG progress, particularly in peace, justice, and environmental sustainability.
160th Burkina Faso (↓ 26 positions)
Conflict, climate stress, and state fragility intersect dramatically in Burkina Faso. The country recorded more than 6,000 civilian deaths in 2025 due to escalating insurgencies((Armed Conflict Location & Event Data Project. (2024). ACLED dashboard: Burkina Faso. ACLED. https://acleddata.com)), and 2.1 million people are now internally displaced((United Nations High Commissioner for Refugees. (2025). Burkina Faso emergency. UNHCR. https://www.unhcr.org)). With a Freedom House score of 15/100 and shrinking political space, governance institutions are weakening just as humanitarian needs expand((Freedom House. (2025). Freedom in the world 2025: Burkina Faso. Retrieved from: https://freedomhouse.org/sites/default/files/2025-02/FITW_World_2025_Feb.2025.pdf)). Food insecurity affects 3.4 million people, exacerbated by prolonged droughts and land degradation. Burkina Faso now ranks 165/166 on the SDG Index, reflecting regression in every human development dimension from hunger to health and education((Sachs, J. D., Lafortune, G., Kroll, C., Fuller, G., & Woelm, F. (2024). Sustainable development report 2024: Financing the SDGs. Sustainable Development Solutions Network. https://www.sdgindex.org)).
102nd El Salvador (↓ 29 positions)
El Salvador presents a nuanced case. The government’s security crackdown has reduced homicides to 2.4% (the lowest in modern Salvadoran history) yet this has come at the cost of democratic safeguards((United Nations Office on Drugs and Crime. (2024). Global study on homicide 2024. UNODC. https://www.unodc.org and International Crisis Group. (2023). El Salvador’s politics of perpetual emergency. International Crisis Group. https://www.crisisgroup.org)). Over 75,000 people have been detained under prolonged emergency powers, prompting a Freedom House rating of 51/100((Freedom House. (2024). Freedom in the world 2024: El Salvador. Freedom House. Retrieved from: https://freedomhouse.org/sites/default/files/2025-02/FITW_World_2025_Feb.2025.pdf )). Meanwhile, inflation, particularly in food items, remains high at over 7%, affecting vulnerable households((Instituto Nacional de Estadística y Censos. (2024). Índice de precios al consumidor. Government of El Salvador. https://www.bcr.gob.sv )). Social trust and institutional credibility remain fragile, and environmental challenges such as deforestation and water contamination hamper sustainable development.
168th Bahrain (↓ 30 positions)
Bahrain’s decline reflects a combination of governance constraints, economic vulnerability, and environmental stress. Its Freedom House rating of 12/100 reflects long-standing restrictions on political opposition and civil liberties((Freedom House. (2025). Freedom in the world 2025: Bahrain. Retrieved from: https://freedomhouse.org/sites/default/files/2025-02/FITW_World_2025_Feb.2025.pdf)). Public debt still exceeds 130% of GDP((Trading Economics. (n.d.). Bahrain government debt to GDP. Trading Economics. Retrieved December 2, 2025, from https://tradingeconomics.com/bahrain/government-debt-to-gdp)), creating fiscal pressures that limit public investment, while inflation in essential goods increases household vulnerability, especially among migrant workers. Bahrain ranks 88/180 in the EPI((Yale Center for Environmental Law & Policy, Yale University. (2024). Environmental Performance Index 2024. Yale University. https://epi.yale.edu)), struggling with emissions, water scarcity, and limited natural habitats. These structural constraints have slowed progress across several SDG domains, contributing to a pronounced decline.
84th Monaco (↓ 36 positions)
Unusual among high-income territories, Monaco also appears among the steepest decliners, largely due to structural constraints in cost of living and environmental performance. With a cost-of-living index above 150 and some of the world’s highest real estate prices, affordability challenges affect not only residents but also the more than 45,000 cross-border workers who sustain the city-state’s economy((Numbeo. (2025). Cost of living index by country 2025. Numbeo.
https://www.numbeo.com/cost-of-living/rankings_by_country.jsp and Numbeo. (2025). Property prices index by country 2025. Numbeo.
https://www.numbeo.com/property-investment/rankings_by_country.jsp)). Environmental indicators penalize Monaco’s limited land availability, high density, and constrained biodiversity. While the principality excels in health and income outcomes, it struggles in areas such as Sustainable Cities and Climate Action, resulting in a composite decline despite overall wealth((While Monaco does not have a full SDG profile released (some SDG data may be not officially reported or available for all goals), the Sustainable Development Report 2025 indicates that SDG indicators are tracked and show Monaco’s relative performance across goals including SDG 11 (air quality, urban environment) and SDG 13 (GHG emissions), although exact values require deeper indicator tables. Sachs, J., Schmidt-Traub, G., Kroll, C., Lafortune, G., & Fuller, G. (2025). Monaco profile: Sustainable Development Report 2025. Sustainable Development Solutions Network (SDSN). Retrieved December 1, 2025, from https://dashboards.sdgindex.org/profiles/monaco/fact-sheet/ )).
138th Tunisia (↓ 40 positions)
Tunisia represents the deepest decline in 2025, driven by an escalating governance crisis, economic instability, and severe climate stress. Its Freedom House score has plummeted to 44/100, following the consolidation of presidential power, restrictions on free expression, and weakening of judicial independence((Freedom House. (2025). Freedom in the world 2025: Tunisia. Freedom House.
https://freedomhouse.org/country/tunisia/freedom-world/2025)). Inflation averaged 7.2% in 2024, unemployment reached 16%, and youth unemployment surpassed 36%((World Bank. (2025). Tunisia macro poverty outlook and economic update. World Bank Group.
https://www.worldbank.org/en/country/tunisia; World Bank. (2025). Unemployment, total (% of total labor force) – Tunisia. World Development Indicators.
https://data.worldbank.org/indicator/SL.UEM.TOTL.ZS?locations=TN and World Bank. (2025). Inflation, consumer prices (annual %) – Tunisia. World Development Indicators.
https://data.worldbank.org/indicator/FP.CPI.TOTL.ZG?locations=TN)). Environmental pressures compound these issues: per-capita water availability has fallen below 300 m³ (far below the extreme scarcity threshold) and 93% of the country faces drought conditions((Food and Agriculture Organization of the United Nations. (2024). AQUASTAT country profile: Tunisia. FAO and https://www.fao.org/aquastat/en/countries-and-basins/country-profiles/country/TUN
Food and Agriculture Organization of the United Nations. (2024). Drought and water scarcity in Tunisia. FAO.
https://www.fao.org/countryprofiles/index/en/?iso3=TUN )). SDG performance has deteriorated across governance, inequality, and employment, placing Tunisia at the top of the global decliners list((Sachs, J., Schmidt-Traub, G., Kroll, C., Lafortune, G., & Fuller, G. (2025). Sustainable Development Report 2025. Sustainable Development Solutions Network (SDSN).
https://dashboards.sdgindex.org)).
Across all the declining countries, a common thread emerges: the convergence of multiple pressures at once. None of these nations is suffering from a single shock or sector-specific crisis. Instead, they face compound vulnerabilities, where economic, social, environmental, and political stresses reinforce one another. High inflation, rising cost of living, and weakened purchasing power appear repeatedly from Pakistan’s high food inflation to Mexico’s persistent consumer-price pressures and Tunisia’s multi-year inflationary cycle. These economic stresses erode household security, deepen inequality, and fuel dissatisfaction, which in turn undermines political trust.
Another shared characteristic is democratic stagnation or regression, whether dramatic or subtle. Countries like Myanmar, Burkina Faso, and Niger present the most extreme versions, where coups or military rule have dismantled constitutional institutions and sharply repressed civil liberties. Even in wealthier monarchies like Bahrain, longstanding structural restrictions limit participation and constrain public debate. Governance pressures are thus a defining feature across the group, creating conditions in which social trust falls and policy effectiveness weakens.
Environmental vulnerability forms another unifying pattern. Many of the decliners rank among the most climate-exposed regions in the world: Niger and Burkina Faso are warming 1.5 times faster than the global average, Tunisia faces unprecedented drought, and Myanmar continues to lose vast areas of forest each year. Urban pollution remains severe in Pakistan and Mexico, exceeding safe thresholds several times over. Environmental degradation does not operate in isolation, it reduces agricultural yields, increases food insecurity, pushes migration, and amplifies economic fragility. The SDG Index captures these interconnected failures: nearly all decliners sit in the bottom half of global rankings, signaling structural struggles in poverty, health, education, and environmental sustainability.
However, some individual cases challenge expectations and reveal that decline is not limited to fragile or low-income states. This is particularly evident in the case of the United States, which stands out among decliners. Unlike most countries in this group, the U.S. is not grappling with widespread institutional collapse, or acute environmental scarcity. Instead, its decline is smoother, more subtle, and rooted in structural shifts within a mature democracy. Rising inequality, stubbornly high living costs, persistent inflation in key sectors like housing and healthcare, and deepening political polarization have all contributed to declining perceptions of well-being and institutional trust.
The United States (↓12 positions), despite its status as a high-income nation, faces rising inequality, political polarization, and environmental vulnerability. The Supplemental Poverty Measure rose to 12.9% in 2023((Burns, K., & DiTommaso, A. (2024, September 10). Supplemental Poverty Measure rose in 2023 for second consecutive year. U.S. Census Bureau. https://www.census.gov/library/stories/2024/09/supplemental-poverty-measure.html)), while CPI-U inflation increased 3.0% from January 2024 to January 2025((Bureau of Labor Statistics, U.S. Department of Labor. (2025). The Consumer Price Index rose 3.0 percent from January 2024 to January 2025 (The Economics Daily). https://www.bls.gov/opub/ted/2025/the-consumer-price-index-rose-3-0-percent-from-january-2024-to-january-2025.htm)). In 2023, the U.S. experienced 28 billion-dollar weather and climate disasters totaling at least $92.9 billion in damages((National Oceanic and Atmospheric Administration. (2024, January 8). 2023: A historic year of U.S. billion-dollar weather and climate disasters. Climate.gov. https://www.climate.gov/news-features/blogs/beyond-data/2023-historic-year-us-billion-dollar-weather-and-climate-disasters Climate.gov and National Oceanic and Atmospheric Administration. (2024). U.S. struck with historic number of billion-dollar disasters in 2023. https://www.noaa.gov/news/us-struck-with-historic-number-of-billion-dollar-disasters-in-2023)). Freedom House scores the U.S. at 84/100 in 2025((Freedom House. (2025). United States: Freedom in the World 2025 country report. https://freedomhouse.org/country/united-states/freedom-world/2025)). Although the U.S. maintains relatively high freedom, increasing institutional tensions and social polarization weaken perceptions of well-being and long-term resilience.
In the area of public safety, one of the key metrics on the Quality of Life dimension of the GPI, the United States continues to face a distinct challenge from gun violence in 2025, even as overall violent crime trends downward((Gun Violence Archive. (2025). Gun violence statistics. Gun Violence Archive. https://www.gunviolencearchive.org)). Firearms remain the primary driver of lethal violence, accounting for the majority of homicides and producing tens of thousands of incidents each year, with impacts heavily concentrated in specific urban and socioeconomically vulnerable areas((Gun Violence Archive. (2025). Gun violence statistics. Gun Violence Archive. https://www.gunviolencearchive.org)). Recent declines in homicide rates have not altered the country’s uniquely high levels of firearm lethality among high-income nations, sustaining elevated perceptions of insecurity and social fragility (Council on Criminal Justice, 2025)((Gun Violence Archive. (2025). Gun violence statistics. Gun Violence Archive. https://www.gunviolencearchive.org)). These dynamics disproportionately affect young men, minority communities, and lower-income neighborhoods and continue to weigh on overall quality of life despite improvements in aggregate crime indicators.
Although the U.S. maintains a strong economy and significant freedoms, these systemic pressures explain why even a high-income democracy appears in a list otherwise dominated by fragile and conflict-affected states.
Macao S.A.R. (↓13 positions) also appears among the decliners due to its heavy dependence on tourism and gaming, which comprise more than 70% of GDP((Gun Violence Archive. (2025). Gun violence statistics. Gun Violence Archive. https://www.gunviolencearchive.org)). Governance restrictions under the “One Country, Two Systems” framework contribute to its Freedom House score of 19/100, and its high cost of living creates affordability challenges((Freedom House. (2025). Freedom in the world 2025: Macau. Freedom House.
https://freedomhouse.org/country/macau/freedom-world/2025)). Environmental stress related to density, emissions, and limited biodiversity further complicates Macao’s sustainability prospects((Sachs, J., Schmidt-Traub, G., Kroll, C., Lafortune, G., & Fuller, G. (2025). Sustainable development report 2025. Sustainable Development Solutions Network (SDSN).
https://dashboards.sdgindex.org)).
Despite their differences, all the countries in decline share one overarching structural feature: they are caught in feedback loops between weakened governance, economic pressure, social strain, and environmental stress. In each case, shocks in one domain spill into others. A drought becomes an economic crisis; an economic crisis becomes political unrest; political unrest obstructs environmental reform; environmental degradation fuels further socioeconomic decline. Where institutions are fragile, this cycle accelerates; where institutions are strong (as in the U.S.) it becomes gradual but still measurable.
This dynamic underscores a crucial insight: decline in the 21st century is rarely linear or confined to one domain. It is multidimensional, interconnected, and deeply influenced by global trends, from climate change and commodity volatility to migration pressures and democratic backsliding. Identifying countries in decline only matters insofar as it helps understand the systemic roots beneath these patterns. The broader lesson from 2025 is that resilience depends on the alignment of economic stability, inclusive governance, environmental adaptation, and social cohesion. When any of these pillars weakens, a nation can absorb the shock.
In this sense, the decliners of 2025 offer a crucial reminder: the stability and progress of nations today depend not only on economic metrics or electoral processes but on the intricate balance between political legitimacy, environmental resilience, social well-being, and institutional trust. Their trajectories illustrate both the fragility of development gains and the urgency of strengthening the systems that support sustainable and equitable futures.
- States seeking to improve or defend their position should prioritise strengthening institutional trust, social protection systems, and rule of law, as these form the backbone of resilient wellbeing outcomes over time.
- Investment in affordability (particularly housing, healthcare, and urban services) is critical, as high living costs increasingly undermine quality of life even in wealthy countries.
- Governments should also embed environmental resilience and climate adaptation into core development strategies, recognising their growing impact on everyday wellbeing.
- Finally, policies that foster migrant inclusion and social cohesion (from access to services to labour-market integration) are no longer optional but central to competitiveness in a world of rising global mobility, where states increasingly compete not just for capital, but for talent and people.
The 2021–2025 results of the GPI show that improvements in Quality of Life rarely occur in dramatic leaps, but rather through steady, cumulative progress grounded in measurable structural change. Countries that rise in the rankings tend to advance simultaneously across human development, institutional quality, environmental sustainability, and social cohesion. This aligns with a broad evidence base: from UNDP’s findings on long-term human development, to the World Happiness Report’s emphasis on trust and social capital, to scholarship linking urban livability and environmental health to subjective well-being. In parallel, countries that are responsive to demographic pressures, climate risks, and social inequalities tend to preserve or enhance their Quality of Life performance over time.
These patterns help explain why global leaders such as the Nordic states, Western Europe, and top performers in Asia and Oceania remain consistently strong. Their progress reflects an equilibrium of effective public investment, robust welfare systems, and high levels of public trust.
Meanwhile, regional standouts like Canada, Japan, Mauritius, and New Zealand show that high-quality living environments are not restricted by geography, but created through coherent policy choices, institutional learning, and long-term commitments to human well-being. Countries that welcome migrants and global talent also tend to strengthen their performance, illustrating that openness is itself a driver of prosperity and quality-of-life resilience.
Ultimately, the 2025 Quality of Life Index underscores a simple but powerful insight: the world’s most desirable passports are not merely those that provide broad mobility, but those that lead to jurisdictions where people can genuinely flourish.
For investors, global professionals, remote workers, and internationally mobile families, this shifts the key question from “Where can I go?” to “Where will I thrive?” At the policy level, the implications are equally clear. Quality of life is no longer just a social aspiration, it has become a strategic asset. Countries that invest in human development, safeguard freedoms, and build sustainable, inclusive societies gain a decisive competitive edge in attracting talent, capital, and long-term residents.