The Global Digital Nomad Report is designed to provide a comprehensive, data-driven evaluation of the best jurisdictions for digital nomads worldwide. It combines quantitative and qualitative factors that influence the decision-making process of mobile professionals, presenting them in a structured and comparable format.
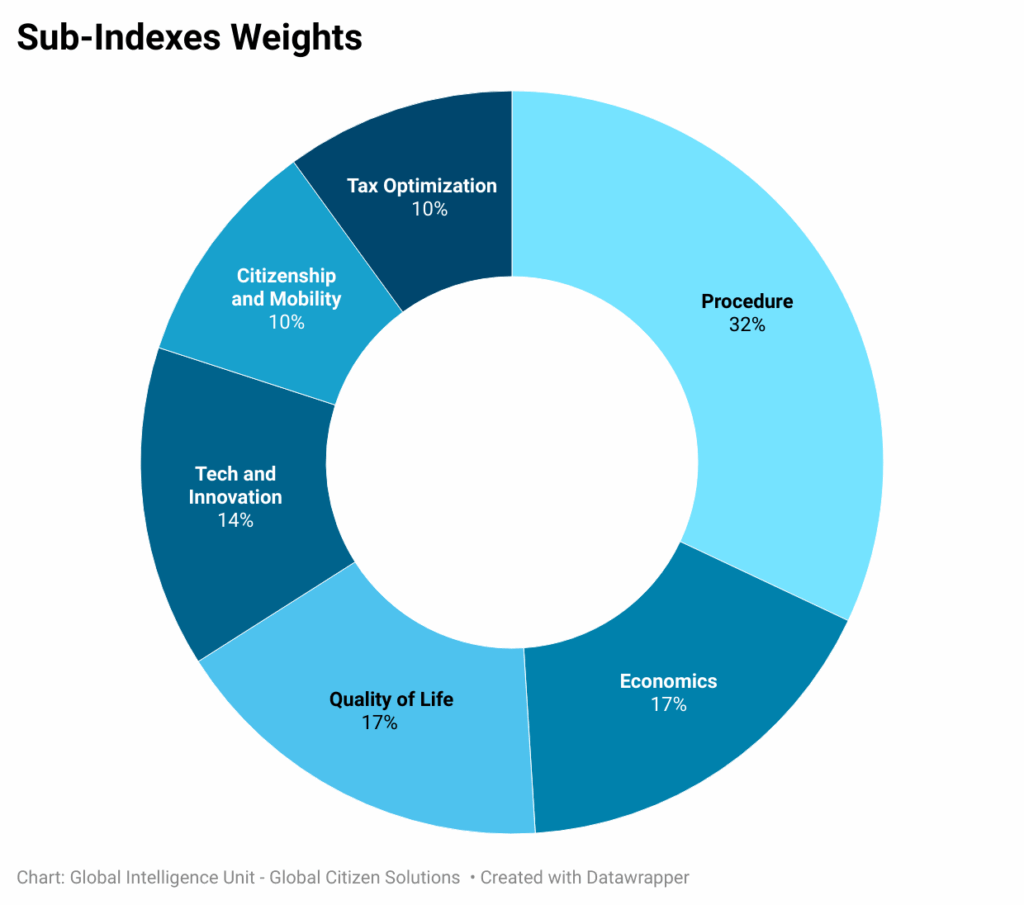
The index is built around six main dimensions – Procedure, Citizenship and Mobility, Tax Optimisation, Economics, Quality of Life, and Tech & Innovation – each composed of carefully selected indicators relevant to the digital nomad lifestyle. The selection of indicators was informed by academic research, industry surveys, experts analisys and insights from our client base, ensuring that the index reflects real-world priorities and challenges faced by nomads.
Data was gathered from reliable, publicly available sources. Each indicator was selected to offer an accurate representation of factors that digital nomads consistently rate as important, including affordability, work environment quality, visa accessibility, and technological infrastructure.
To ensure comparability, all indicators were normalized using the Min-Max Normalization formula, rescaling values to a [0, 1] range. This prevents indicators with larger numerical scales from disproportionately influencing results.
- “Lower is better” was applied to: visa costs, income requirements, coworking prices, and top marginal tax rates.
- “Higher is better” was applied to: internet speed, innovation scores, quality of life, and English proficiency, etc.
Weights were assigned to each indicator based on its relevance to digital nomads’ decision-making, as determined from academic literature, industry expert consultation, and survey insights.
1. Procedure Index
Visa Costs – Includes official application fees and income requirements for digital nomad visas or equivalent programs. Data was primarily sourced from government websites, supplemented by reputable secondary sources. Countries with lower costs and requirements scored higher after applying the “lower is better” normalization.
Visa Benefits – Composite of visa duration, path to citizenship, and possibility of extension:
- Visa duration
- On line application
- Possibility of extension
2. Citizenship and Mobility Index
This dimension reflects the ability of digital nomads to integrate long-term into a country’s legal framework. It incorporates the “path to citizenship” scoring described above and is weighted to reflect the significance of long-term settlement opportunities for some nomads.
3. Tax Optimisation
We analyzed the top marginal tax rate in each jurisdiction, normalizing values so that lower tax rates scored higher (“lower is better”). This indicator allows nomads to evaluate the potential tax burden of working from a given country.
4. Economics Index
For the economic indicators, we used three primary sources: the Cost of Living Index from Numbeo and the Coworking Desk Price Index from Hot Desk Price Index . Regarding tax optimization, we normalized the highest tax rates for each of the 65 countries in the index.
The Cost of Living Index provides a comprehensive overview of the general expenses associated with living in different countries, including housing, groceries, transportation, and other essential costs. The Coworking Desk Price Index offers data on the average cost of renting a coworking space, which is a crucial factor for digital nomads who often rely on such facilities for their work. To assess tax optimization, we normalized the highest tax rates in each country to provide a clear comparison of tax burdens. Each of these indicators was assigned a score ranging from 0 to 1, with higher scores indicating more favorable economic conditions.
This data was collected from publicly available information and was standardized (“lower is better”) to ensure comparability across different countries. By normalizing the data and using a consistent scoring system, we were able to create a clear and concise sub-ranking of economic indicators.
5. Quality of Life Index
The quality of life indicator is a composite measure comprising two sub-indicators: quality of life and English proficiency. The quality of life data was sourced from Numbeo , which uses a comprehensive formula to calculate its index. This formula incorporates various factors such as purchasing power, house price-to-income ratio, safety, healthcare, traffic time, pollution, and climate. Scores were assigned on a scale from 0 to 1, with higher scores indicating more favorable conditions.
For English proficiency, the data was obtained from the EF English Proficiency Index . This index assesses the average level of English skills in each country. Similar to the quality of life scores, English proficiency scores were also assigned on a scale from 0 to 1, with higher scores representing better proficiency. Both sub-indicators were crucial in determining the overall quality of life for digital nomads considering different countries.
The data for this analysis was collected from publicly available information, primarily from official government websites and secondary sources. To ensure comparability, the data was normalized using a “higher is better” approach, meaning countries with higher scores were placed at the top of this sub-ranking. This method provides a clear and standardized comparison of the quality of life and English proficiency across different countries, helping digital nomads make informed decisions.
6. Tech & Innovation Index
For the tech and innovation sub-index, we used the Internet Speed Index from Ookla Speedtest and the Global Innovation Index (GII) from the World Intellectual Property Organization (WIPO) . Ookla Speedtest is renowned for accurately testing the performance and quality of internet connections. It measures various factors impacting connectivity, such as bandwidth, latency, coverage, and video metrics.
The Global Innovation Index (GII) from WIPO offers a comprehensive assessment of innovation across approximately 132 economies. It uses around 80 indicators to evaluate the political environment, education, infrastructure, and knowledge creation. The GII highlights the innovation strengths and weaknesses of different economies, allowing for performance monitoring and benchmarking against regional and income group peers. This index is particularly valuable for understanding the broader innovation landscape in each country.
Scores for both the Internet Speed Index and GII were assigned on a scale from 0 to 1, with higher scores indicating more favorable conditions. The data for this analysis was collected from publicly available sources, primarily official government websites and secondary data. To ensure comparability, the data was normalized using a “higher is better” approach. This method ensures that countries with superior tech and innovation environments received higher scores, providing a clear and standardized comparison for evaluating digital nomad visa benefits across different countries.
Final Index Calculation
The overall score for each country was calculated by:
- Normalizing each indicator to a 0–1 range.
- Applying weights based on relevance to digital nomads.
- Summing weighted scores across all indicators.
This method ensures balance, fairness, and transparency, allowing countries to be compared directly while recognizing that digital nomad priorities are multi-dimensional.
The result is a 64-country ranking that identifies the most attractive jurisdictions for digital nomads, accounting for not just affordability or visa length, but the complete ecosystem required for a thriving nomadic lifestyle.