
Real estate has remained a core allocation in family office and HNWI portfolios, and its role has only grown more central in recent years. Investors increasingly treat it not as a passive hedge, but as an active return driver that combines income, capital appreciation, and geographic diversification. As the briefing shows, the academic and industry case for this positioning is well established. Less examined is where, specifically, sophisticated cross-border capital is concentrating.
This briefing addresses that question directly by examining structural and policy-responsive drivers. The framework’s contribution is to treat these two driver types as analytically distinct yet operationally linked. Structural drivers determine which markets attract capital in the first place. Policy-responsive drivers determine the speed, volume, and submarket concentration with which that capital arrives.
The briefing examines ten city markets and creates and illustrative sample of cities selected for their sustained presence in cross-border investment flow data and their coverage of distinct market types, spanning established gateway cities, high-growth destinations, and European markets where structural demand and policy-responsive capital have recently intersected.
The analysis draws on capital appreciation data, transaction volumes, foreign buyer activity, and program reform events across the 2020 to 2024 period to assess how each driver type has shaped market outcomes in practice.

Real estate occupies a distinctive position among investable assets. Unlike equities or bonds, it generates income through rents, appreciates value over time, and maintains a degree of resilience during inflationary periods that purely financial instruments often cannot match.
This combination of current yield, long-run capital growth, and inflation responsiveness is difficult to replicate within a single asset class, and it underpins real estate’s enduring role as a foundational allocation in sophisticated portfolios.
A landmark study of long-run returns across 16 advanced economies found that over nearly 150 years, residential real estate and equities have delivered comparable total returns, averaging around 7% per annum in real terms, but real estate has done so with considerably lower volatility and less sensitivity to the business cycle (Jordà et al., 2019). That risk-adjusted profile is what distinguishes real estate from most other alternative allocations, and why it retains a structural role in portfolios even when short-term market conditions shift.
The academic case for including real estate in a mixed-asset portfolio is well established and has only strengthened in recent years. A study examining real estate exchange-traded notes (ETNs) across the US, UK, France, and Germany from 1996 to 2009 finds consistent diversification benefits from including real estate in mixed portfolios across multiple allocation strategies, with the primary source of gains being risk reduction relative to stock and bond portfolios – benefits that become particularly pronounced during periods of economic stress (Günther et al., 2022).
More recent analysis confirms that this holds across most interest rate environments. Lee (2026), examining US unlisted real estate returns across seven distinct rate phases from 1999 to 2024, finds that sector-specific real estate consistently added value in institutional mixed-asset portfolios through stronger downside risk-adjusted returns relative to bonds and stocks, with allocations averaging 9.5% during rate-easing phases and 7.5% during rate-tightening phases. The notable exception was the 2022–2024 tightening cycle, during which the fastest rate increases in 35 years triggered broad real estate devaluations and effectively crowded out unlisted allocations. Thus, real estate’s diversification role is durable across normal rate cycles, but sensitive to the pace of monetary tightening.
Industry data reflects the closing of that gap. The UBS Global Family Office Report 2025, drawing on 317 single family offices with an average AUM of $1.1 billion, documents continued strategic allocations to real estate across all regions in 2024, while noting explicitly that performance prospects depend on local market condition. This is a qualifier that explains the wide regional variation observed (UBS, 2025). US family offices allocated 18% of portfolios to real estate, and Middle Eastern portfolios 14%, while other regions clustered around lower averages. Beyond allocation weights, the direction of capital flows is that HNWIs and family offices have been the largest buyers of global commercial real estate for five consecutive years, deploying $464 billion in 2025 (Knight Frank, 2026).
The scale of cross-border capital deployment documented above does not distribute randomly across markets. As the literature reviewed here establishes, real estate performance diverges significantly by location shaped by local market conditions, interest rate environments, and the structural characteristics of individual submarkets rather than asset class dynamics alone.
Broader FDI Landscape
The broader FDI picture provides context. Global FDI flows declined from 2022 through 2023 amid overlapping geopolitical and economic pressures. Headline FDI rose 4% to $1.5 trillion in 2024, but this increase was driven by volatile financial conduit flows through several European economies; UNCTAD’s underlying, conduit-adjusted measure instead fell 11%, marking a second consecutive annual decline (UNCTAD, 2023, 2025).
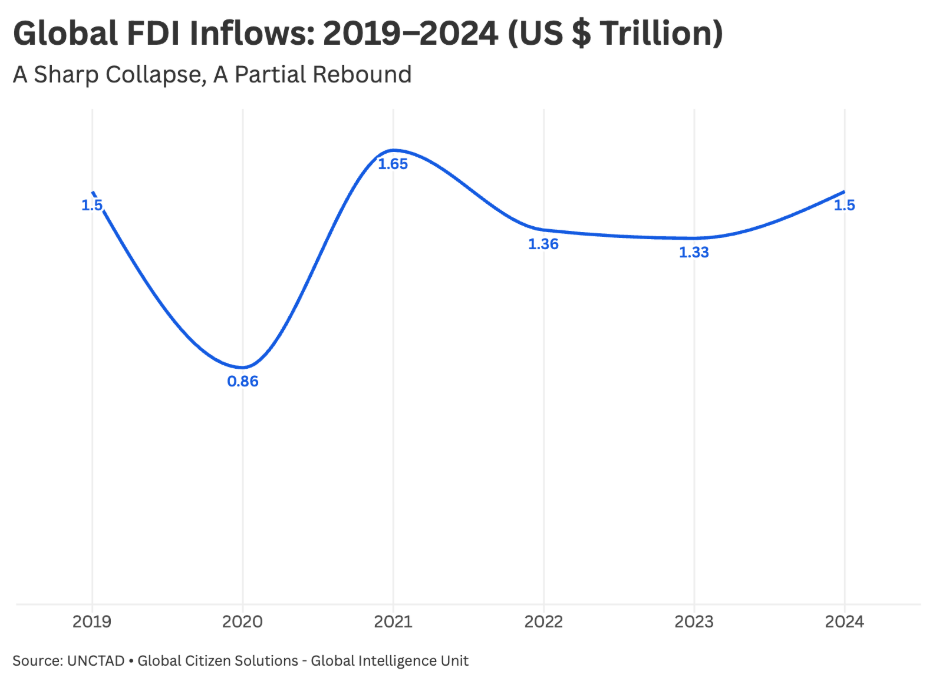
Figure 1. FDI Inflows Across the World
The FDI data above establishes the macro context: aggregate cross-border flows remain under pressure and increasingly selective, which makes the question of where capital does concentrate more pointed, not less. The driver framework below explains the mechanism behind that concentration.
Structural drivers: Structural drivers set the terms of market entry: depth and liquidity, legal certainty of ownership, currency and political risk, and supply constraints. They evolve slowly, reflecting underlying market architecture, though currency is a partial exception given its capacity for rapid movement. Yield is best understood as downstream of these conditions, an output that signals whether prevailing prices remain justified rather than an input in its own right.
Policy-responsive drivers: These drivers govern timing and concentration rather than market eligibility. Investment migration programs establish a residency-linked demand channel; reforms or closures redirect that channel without eliminating it. Ownership restrictions and tax measures operate inversely, constraining rather than attracting foreign demand. Each is discrete, traceable to a specific decision, and reversible, though ownership restrictions can converge with the legal framework when a reform redefines who may purchase at all.
Global Real Estate Value
The fundamental and policy-responsive drivers identified above do not operate uniformly across global real estate markets; they rather concentrate.
The question, then, is where.
Globally, real estate deal value reached $873 billion in 2025, up 12% year on year, with capital concentrating on more targeted opportunities and larger average ticket sizes rather than dispersing across a broader set of markets (McKinsey, 2026).
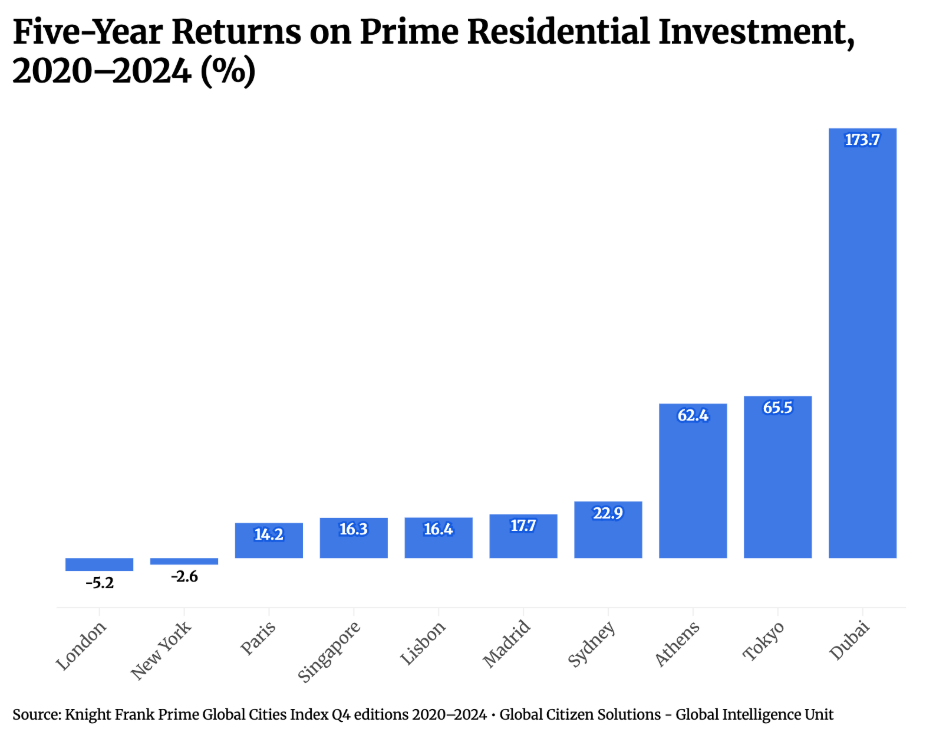
Figure 2. Prime Residential Capital Appreciation, 2020–2024
The chart shows how home values changed across ten major cities between 2020 and 2024. It focuses on property price growth only and does not include rental income, taxes, or buying and selling costs. Athens is based on data for the wider apartment market rather than the luxury segment used for the other cities, while Lisbon covers 2021–2024 because earlier data was unavailable. Returns (2020–2024 Net Result) reports cumulative percentage change in prime residential prices, not an annual average or CAGR, sourced from Knight Frank’s Prime Global Cities Index (Q4 editions, 2020–2024).
Three cities stand out for the strongest price growth: Dubai (+173.7%), Tokyo (+65.5%), and Athens (+62.4%). Dubai’s rise reflects strong international demand and a sustained influx of wealthy buyers, visible in record transaction volumes at the prime end of the market, including more than 4,600 sales above AED 10 million in 2024 (Savills, 2025a). Tokyo benefited from a weaker yen, making property cheaper for foreign buyers, with total foreign real estate investment reaching JPY 2.3 trillion ($15.7 billion) in 2024 (Japan Living Life, 2026).
At the other end of the scale, London and New York were the only cities to record overall price declines during this period. The remaining cities such as Paris, Sydney, Madrid, Singapore, and Lisbon, experienced steady but more moderate growth of around 14–23%.
Further analysis on London shows that the figures presented above on -5.2% still hold, and current data suggests the market hasn’t turned a corner yet. ONS data show nine consecutive months of annual price falls in London, down 2.1% to April 2026, the weakest of any English region (ONS, 2026). At the prime end, Coutts’ Q1 2026 index puts prime London down 2.7% year-on-year and 13.2% below its 2014 peak, while LonRes’s index, which splits the two submarkets, shows prime central London down 7.0% annually against 5.0% for wider prime London (Coutts, 2026; LonRes, 2026).
The two indices differ on scale but agree on direction, and the detail underneath explains why. Coutts’ Q4 2025 data show £10m+ deal volumes down 36% year-on-year, with the biggest discounts sitting in the £5m-£10m band (Coutts, 2026), exactly the price range the mansion tax’s top rate and the non-resident stamp duty surcharge were built to hit. Outer prime areas, largely outside that band, are holding up noticeably better than prime central London over the same period (Coutts, 2026). The pattern is simple: the part of the market the tax changes targeted is the part that’s struggling, and the part they didn’t touch is doing comparatively fine.
Taken together, this doesn’t look like London losing its appeal as a destination for capital, it looks like the correction is concentrated exactly where the recent tax measures were aimed. The depth, the transparency, and the base of international capital are still there, visible in the 62% foreign buyer share, the £84.2 billion in foreign-owned homes, and the money now flowing back into offices. What’s changed is the economics of holding property at the very top of the residential market, where the mansion tax, the stamp duty surcharge, and non-dom abolition all land at once.
The table below categorizes each city on structural strength (a composite of economic depth, legal certainty, and supply constraint), policy-responsive exposure (the extent to which recent price and volume movement is attributable to a specific investment migration program, reform, or ownership restriction), the status of any migration channel, and the net five-year outcome discussed above.
Each city gets a magnitude (Low/Medium/High/Very High depending on how much of its 5-year price move is policy vs. structural-driven) plus a direction tag showing which way policy cuts for foreign capital, either favorable, adverse, domestic policy only and currency/rate risk.
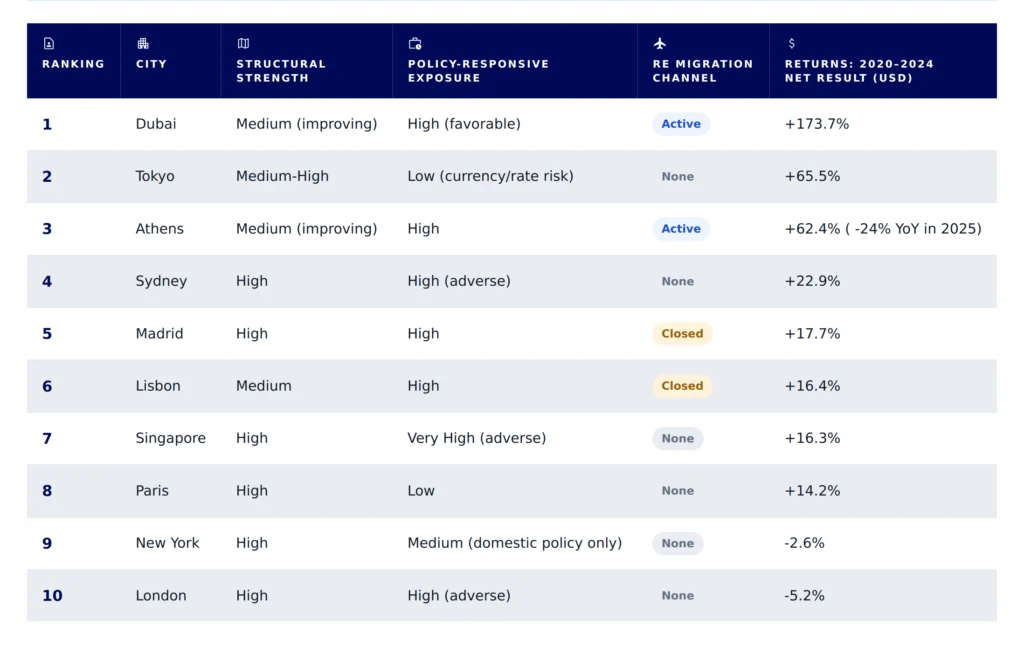
The ten cities were selected for their presence across the cross-border investment benchmarks that track this kind of capital, including CBRE’s Global Real Estate Capital Flows report, Knight Frank’s Wealth Report and Prime Global Cities Index, and Savills’ Prime Residential World Cities Index, and for their coverage of distinct market types: established gateway cities, high-growth destinations, and European markets reshaped by investment migration reform. Not every city appears in every index; Athens in particular is included primarily as a case of investment-migration-driven demand rather than as a benchmark fixture. Together they provide a balanced view of where the capital is going, rather than a list built around any single report’s house view.
Singapore functions as the control case in this sample: a structurally top-tier market in which policy operates to restrict foreign capital rather than attract it, in contrast to Dubai and Athens, where the policy-responsive layer works to draw capital in.
London
London draws international buyers from more than 50 countries into a deep, transparent, and legally secure market. What has changed is not the fundamentals but the policy environment.
CURRENT STATE
International buyers from more than 50 countries have made up 62% of central London property sales since 2016 (CBRE, 2025b); five-year appreciation is -5.2%, one of only two declines in the sample. Moreover, Foreign-owned homes across England are worth £84.2 billion combined, with London holding £43.9 billion, over half the national total (The Intermediary, 2026).
STRUCTURAL DRIVERS
A stable legal system, a transparent and internationally recognized market, and deep transaction liquidity all remain intact.
POLICY DRIVERS
The non-domicile tax status abolition and the 2% non-resident stamp duty surcharge were already in force (GOV.UK, 2025,) before the November 2025 Budget added a “mansion tax” on homes over £2 million, to be collected from April 2028, alongside a two-percentage-point property income tax rise from April 2027 (HomeOwners Alliance, 2025).
RISKS
The measures are enacted or scheduled; the open question is how strictly the mansion tax is enforced, given the UK’s widely flagged property-ownership transparency gaps.
INVESTOR FIT
Capital preservation and liquidity, rather than near-term appreciation.
New York
New York’s institutional depth is evident in its foreign investment activity, yet five-year price appreciation has been negative. The distinguishing feature is income rather than capital growth: prime yields well above the global average continue to draw cross-border capital even through flat price years.
CURRENT STATE
New York attracted $2.3 billion in foreign commercial investment in H2 2024, more than any other North American market, including two Manhattan office deals above $500 million each (CBRE, 2025a); five-year appreciation is -2.6%.
STRUCTURAL DRIVERS
Institutional depth is evident in New York’s investment volumes, the largest of any North American market in H2 2024 (CBRE, 2025a); prime gross yields sit above 5%, against a 3.15% global prime average (Savills, 2025b).
POLICY DRIVERS
The live policy variables are domestic, rent regulation, property tax, and zoning.
RISKS
The negative five-year figure mostly reflects sensitivity to the 2022–2024 rate-tightening cycle, not structural decline. The Federal Reserve held rates steady through the first half of 2026, with cuts pushed to 2027 (CNBC, 2026b).
INVESTOR FIT
Income-oriented capital, rather than capital, chasing pure appreciation.
Paris
Paris combines supply scarcity with enduring demand for premium addresses, a combination that has kept prime prices rising even as transaction volumes fall. This is a market defined by structural constraint rather than policy or demand shocks, and it rewards patience over speed.
CURRENT STATE
Prime prices are up 12% since the pandemic, to €22,730 per square meter, even as H2 2024 volumes hit their lowest since early 2020, 12,220 sales (Knight Frank, 2025); five-year appreciation is +14.2%, the softest positive return in the sample.
STRUCTURAL DRIVERS
Fewer than 2,000 new homes are completed each year; hôtels particuliers have transacted near €50,000 per square meter (Knight Frank, 2025). Scarcity, not a demand shock, drives the price and volume moving in opposite directions.
POLICY DRIVERS
No foreign-buyer-specific policy shift has occurred in the period; transaction costs are longstanding rather than new.
RISKS
Modest 2.5–3.0% yields and a slow resale market offer little to near-term income or appreciation buyers.
INVESTOR FIT
Long-term value built on structural scarcity, rather than income or quick gains.
Tokyo
Tokyo had the second-strongest appreciation in the sample, driven by a supply shortage and amplified by a weak yen that lowered the effective entry cost for foreign buyers. The market is fully open to foreign ownership, but its trajectory is closely tied to Bank of Japan monetary policy, making that the key variable to watch.
CURRENT STATE
Five-year appreciation is +65.5%; foreign buyers account for up to 40% of new central Tokyo apartment sales, and total foreign real estate investment reached JPY 2.3 trillion ($15.7 billion) in 2024 (Japan Living Life, 2026).
STRUCTURAL DRIVERS
New condominium releases fell to their lowest level since 1980 nationally (Patience Realty, 2025). Overall, the ownership framework is fully open to foreign buyers.
POLICY DRIVERS
The key lever is the yen’s prolonged slide, which has substantially lowered the effective entry cost for dollar- and euro-based buyers over the past decade.
RISKS
Bank of Japan normalization would strengthen the yen and raise borrowing costs together. The policy rate held at 0.75% in early 2026, with further tightening signaled (CNBC, 2026a).
INVESTOR FIT
Investors comfortable underwriting currency and monetary policy risk.
Sydney
Sydney delivered the strongest returns of any city outside the top three, despite having the most restrictive foreign-ownership rules in this sample. The market quality is not in question; the constraint is access, with foreign capital increasingly channeled into new-build and commercial assets.
CURRENT STATE
Overseas investors put AUD 10.52 billion into Australian real estate in FY2024 (M3 Property, 2024), increasingly via commercial channels; five-year appreciation is +22.9%, the strongest outside the top three.
STRUCTURAL DRIVERS
The market remains mature, transparent, with strong long-run fundamentals; the constraint is access, not quality.
POLICY DRIVERS
FIRB approval and state surcharges apply. The established-home purchase ban took effect on 1 April 2025 for an initial two-year period, and was extended in the 2026–27 Federal Budget to run through 30 June 2029 (Australian Taxation Office, 2026).
RISKS
The restriction was already extended once, before its first deadline; whether it lapses or extends again past 2029 is the key variable to watch.
INVESTOR FIT
Investors accepting regulatory complexity for a mature market, via new-build or commercial vehicles.
Dubai
Dubai recorded the highest appreciation in the sample by a wide margin, combining rapid population growth with an open and tax-light policy regime. A large share of its recent gains is policy-responsive, but the underlying demographic trajectory gives the structural case real durability.
CURRENT STATE
Five-year appreciation is +173.7%, the highest in the sample; 2024 transaction volumes rose 47%, with more than 4,600 units above AED 10 million transacted (Savills, 2025a). Foreign nationals hold approximately 43% of the total value of all residential property in Dubai (Alstadsæter et al., 2024).
STRUCTURAL DRIVERS
Population reached 3,863,600 by the end of 2024 and is projected to reach five million by 2030 (Dubai Statistics Center, 2025), underwriting demand independent of investor activity.
POLICY DRIVERS
There is no property tax and no capital gains tax, and full foreign freehold ownership applies in designated areas (Provident Estate, 2026) alongside an active Golden Visa tying investment to residency.
RISKS
The pace of gains raises a durability question; the population trajectory is the strongest reason to expect the structural component to hold.
INVESTOR FIT
The strongest mix of openness, yield, and residency-linked upside in the sample, with a caveat on the policy-responsive share of recent gains.
Singapore
Foreign transaction share collapsed under successive stamp duty hikes, yet prices held over the five-year period, showing that domestic and non-restricted capital is carrying the market. This makes Singapore the control case in the sample: a structurally strong market where policy works to restrict foreign capital rather than attract it.
CURRENT STATE
Foreign new-home purchases fell to 2% of transactions by mid-2024, from 4-7% previously (PropertyLimBrothers, 2025); five-year appreciation still reached +16.3%, ahead of Paris.
STRUCTURAL DRIVERS
Political stability, legal certainty, and wealth-management infrastructure are well established; Singapore entered JLL’s “Highly Transparent” tier in 2024 by a focus on sustainability and digital services and ranks in the top 10 of the Global Passport Index (Global Citizen Solutions, 2025a).
POLICY DRIVERS
Successive stamp duty increases culminated in a 60% Additional Buyer’s Stamp Duty for overseas buyers in April 2023 (PropertyLimBrothers, 2025), the largest foreign-buyer-specific cost in the sample.
RISKS
At that cost, the conventional return case is difficult to justify near-term, with no sign of reversal.
INVESTOR FIT
A narrow fit, for investors able to absorb the 60% ABSD in exchange for stability and legal certainty.
Madrid
Spain’s Golden Visa was officially discontinued in 2025, yet foreign purchases nationally reached a record that year and Madrid still posted positive five-year appreciation, showing that a national program closure did not remove foreign demand. The more consequential risk for Madrid is local rather than national, centered on new restrictions targeting short-term rental income in the city.
CURRENT STATE
Foreigners bought nearly 97,500 properties nationally in 2025, a record, though their share slipped to 13.8% (Idealista, 2026); Madrid’s five-year appreciation is +17.7%.
STRUCTURAL DRIVERS
National demand is unevenly spread, with Alicante leading at 43% foreign share (Idealista, 2026); Madrid’s own demand is driven more by domestic and EU buyers than the coastal foreign-buyer concentration seen elsewhere in Spain.
POLICY DRIVERS
The Golden Visa closure removed a national channel; the more consequential local event is the RESIDE Plan (May 2025), which restricts tourist apartments against a backdrop of more than 15,000 illegal units already operating (Iberian Property, 2025).
RISKS
Investors reliant on central-Madrid short-term rental income face a direct policy-driven hit, separate from the Golden Visa policy.
INVESTOR FIT
Demand survives the program closure, but investors need to separate the national headline from RESIDE’s city-specific risk.
Lisbon
Lisbon is the clearest case in the sample where removing a residency-linked channel did not remove underlying demand, because the structural driver behind that demand never went away. Chronic undersupply, not the Golden Visa, is the more durable explanation for its continued foreign investment.
CURRENT STATE
Foreign investment in Lisbon’s Urban Rehabilitation Area reached €879.5 million in 2025, down about 3% from €906.5 million on roughly 12% fewer transactions, with average transaction size up 10% to €631,800 (Essential Business, 2026); appreciation is +16.4% over 2021–2024.
STRUCTURAL DRIVERS
Savills Portugal reported rising foreign enquiries after the 2023–2024 changes, attributing continued demand to undersupply rather than weaker interest (The Portugal News, 2023).
POLICY DRIVERS
The October 2023 Mais Habitação Law removed real estate as a Golden Visa route (Global Citizen Solutions, 2026b); the Non-Habitual Resident tax regime closed to new applicants in January 2024.
RISKS
Prices remain below comparable to Western European capitals, but the same undersupply limits transaction-volume growth.
INVESTOR FIT
A supply-constrained market with a low cost of entry and none of the regulatory barriers that apply in London, Paris, or Singapore.
Athens
Threshold-driven demand held strong through 2024, then fell 24% year on year once the transition period ended. Athens is the clearest case of a lagged policy effect in the sample, distinct from the outright program closures seen in Lisbon and Madrid.
CURRENT STATE
Net overseas real estate inflows reached €2.75 billion in 2024, up 28.9% on 2023 and nearly €4.9 billion over two years (The National Herald, 2025); inflows then fell 24% year on year in the first three quarters of 2025 (-32.7% in Q3), as Golden Visa applications dropped 47% (Greek City Times, 2025).
STRUCTURAL DRIVERS
Comparatively low entry prices combine with fundamentals that have kept improving since the post-crisis recovery, supporting +62.4% five-year appreciation, one of the strongest in the sample.
POLICY DRIVERS
Law 5100/2024, enacted in April 2024 with new thresholds effective from 1 September 2024, raised the prime-location Golden Visa threshold to €800,000, from €500,000 previously in those zones and €250,000 elsewhere (Global Citizen Solutions, 2026a). Demand held through 2024 via buyers who locked in the old thresholds with a 10% deposit by 31 August 2024, then fell once the extended transitional completion deadlines lapsed by 30 April 2025.
RISKS
A threshold increase, not a closure, produced a lagged pullback once transitional pricing expired; the 2025 figures are the more useful read on where Athens is headed.
INVESTOR FIT
Still among Europe’s more accessible growth markets, but the buyer mix is shifting from residency-driven to longer-term investment demand (Greek City Times, 2025).
Comparative Insights
- Program removal does not equal demand removal, though timing matters. Portugal, Spain, and Greece, the three European markets that underwent significant policy changes between 2023 and 2025, all recorded sustained foreign buyer activity through the point of reform. Portugal and Spain, which removed the real estate route from their golden visa programs, saw demand hold through the reform year itself. Greece is a more complex case: it raised its investment threshold rather than closing the program, and demand held through 2024 largely because a transitional window allowed investors to qualify at the previous threshold. Once that window closed in April 2025, real estate FDI fell 24% year on year (Greek City Times, 2025). The evidence suggests that investment migration programs amplify existing foreign demand rather than create it. It also suggests that reform design matters: whether a route is closed outright or repriced with a transition period shapes whether that resilience holds or eventually gives way.
- The strongest-performing markets over the past five years are not necessarily the deepest institutional markets. Dubai (+173.7%), Tokyo (+65.5%), and Athens (+62.4%) significantly outperformed London (-5.2%) and New York (-2.6%) between 2020 and 2024. What these markets share is constrained supply combined with market-specific advantages: favorable currency dynamics in Tokyo, investment migration incentives in Dubai and Athens. This suggests that the drivers of outperformance in the current cycle differ from those that traditionally define institutional-grade investment markets.
- The regulatory environment has become a decisive differentiator between otherwise comparable markets. London, Sydney, and Singapore are considered among the world’s transparent and institutionally mature real estate markets, yet each has introduced significant measures affecting foreign buyers in recent years, including stamp duty surcharges, ownership restrictions, and tax reforms. Institutional maturity, in other words, no longer guarantees openness to foreign capital; the two move independently.
Other interesting cases worth exploring are these three markets outside the ten-city sample, each testing the framework differently.
Miami reached 80.3% five-year growth to Q2 2025, and Seoul reached 80.9%, both from the same Knight Frank index behind Figure 2, trailing only Tokyo and Dubai (Knight Frank, 2025b). Miami’s risk is structural rather than policy-driven: the same growth that drew capital in now sits alongside condo insurance premiums that rose 102% over three years (Urban Land Institute, 2024), a pressure absent from the original ten. Seoul’s case mirrors Athens. It also posted the fastest annual growth of any city tracked that quarter (DM Properties Marbella, 2025), and within weeks that growth met restriction: effective August 26, 2025, the Seoul metropolitan area became a foreign land transaction permit zone, requiring approval and two years’ residency before a foreign buyer could close (IMI Daily, 2025). Athens took roughly a year to show that same growth-then-restriction sequence; Seoul compressed it into a single quarter.
São Paulo marks a third pattern: institutional capital moving in through a channel that is not linked to a residency program. Canada’s largest pension fund, CPP Investments, committed R$1.7 billion alongside Cyrela, Brazil’s largest homebuilder, to a São Paulo luxury residential venture in January 2025, targeting R$6 billion in sales (CPP Investments, 2025), building on a multifamily partnership the two have run since 2019. That capital sits in a market where the prime segment above R$3 million has grown at a 21.7% compound annual rate since 2023, roughly ten times the city-wide average near 2% (The Rio Times, 2026). This particular example is not tied to a residency channel or a policy, a genuinely different kind of capital from the policy-responsive layer this briefing otherwise tracks.

The city profiles point to a pattern: in markets where investment migration programs have been active, most clearly Athens, Lisbon, Dubai, and Madrid in the years before its Golden Visa’s real estate route closure, foreign capital behaves differently from the broader FDI baseline. It concentrates on specific price bands, responds to program thresholds rather than yield signals, and redistributes when policy conditions change.
This capital functions as its own demand layer: policy-responsive, geographically concentrated, and easier to trace than most cross-border flows. The 2022–2025 reform cycle is a useful test case. When Portugal and Spain removed RE option from their residence programs, foreign demand held broadly stable rather than exiting the system. Greece’s experience adds nuance to that finding rather than contradicting it: a threshold increase with a transitional grace period produced resilient demand through 2024, followed by a documented 24% decline in early 2025 once the grace period lapsed (Greek City Times, 2025). This suggests that the mechanism of a reform, and its timing, matter as much as its direction. In all three markets, foreign demand remained heavily concentrated in a handful of provinces and submarkets, which is reason to keep monitoring the program landscape, including how transition periods are designed, alongside conventional market indicators as a leading signal of where foreign real estate demand concentrates next.
Read forward, the framework suggests structural pressure is likely to concentrate in markets where supply constraints are already binding, Paris, Lisbon, and Dubai among them, where continued scarcity or population growth may keep testing the pace of new supply.
Policy-responsive pressure appears concentrated in the opposite direction: Sydney, Singapore, and London all carry now-enacted foreign-buyer measures whose durability, rather than their existence, is the more open question, while Athens and Madrid suggest that a program’s design and timing, not only its direction, can continue to shape demand well after the reform itself. On this reading, the markets most exposed to change over the next two to three years may be those where the two driver types interact, rather than where either operates in isolation.
This briefing applied a structural and policy-responsive framework across ten hotspot cities to identify where cross-border capital concentrates and why. Three findings extend beyond the patterns already identified above.
First, the price effect of policy-responsive measures is conditional on the foreign share of total demand. In Sydney and Singapore, the two markets carrying the most restrictive foreign-buyer measures in the sample, prices continued to rise because domestic and non-restricted capital account for the majority of transactions; the restrictions redirected foreign demand into new-build, commercial, or fund structures rather than suppressing the market. Where foreign capital represents a smaller share of total demand, policy measures should be expected to reshape the composition of investment before they visibly affect price.
Second, capital appreciation alone is an insufficient basis for assessing market performance. New York scores ninth of ten cities on five-year price growth, yet its prime yields sit near double the global average, indicating that investor return has shifted from capital growth to income rather than disappeared. A scoring built on appreciation alone would misread this shift as underperformance.
Third, investment migration functions as a distinct capital layer rather than a proxy for broader foreign investment. Demand tied to residency thresholds is traceable through application data, concentrates on specific submarkets, and responds to program design rather than yield. This makes program activity, thresholds, and reform timing a useful indicator of where foreign real estate demand is likely to concentrate next
Together, these findings indicate that no single indicator, whether policy direction, appreciation, or program activity, is sufficient to assess a market in isolation. The cities identified in the outlook above, where structural and policy conditions are both in motion, are where this interaction is most likely to produce the next divergence between headline appreciation and underlying performance.
References
Alstadsæter, A., Collin, M., Planterose, B., Zucman, G., & Økland, A. (2024). Foreign investment in the Dubai housing market, 2020–2024. EU Tax Observatory. https://www.taxobservatory.eu/www-site/uploads/2024/05/Note_Foreign-investment-in-the-Dubai-housing-market.pdf
Australian Taxation Office. (2026). Foreign investment — extending the ban on foreign purchases of established dwellings. https://www.ato.gov.au/about-ato/new-legislation/in-detail/international/banning-foreign-purchases-of-established-dwellings
CBRE. (2025a). H2 2024 global real estate capital flows. https://www.cbre.com/insights/reports/h2-2024-global-real-estate-capital-flows
CBRE. (2025b, November 19). New CBRE research reveals London’s real estate landscape is changing. https://www.cbre.co.uk/press-releases/new-cbre-research-reveals-londons-real-estate-landscape-is-changing
CNBC. (2026a, January 23). Bank of Japan raises economic growth forecasts ahead of snap election, holds rates at 0.75%. https://www.cnbc.com/2026/01/23/boj-rate-decision-snap-election-takaichi-gdp.html
CNBC. (2026b, June 17). Fed interest rate decision June 2026: Fed holds rates steady. https://www.cnbc.com/2026/06/17/fed-interest-rate-decision-june-2026.html
Coutts. (2026, April 30). London Prime Property: Compelling value in central while outer markets move upwards. https://www.coutts.com/insights/property/coutts-london-prime-property-index-activity-returns-to-prime-central-london.html
Coutts. (2026, February 4). London Prime Property Index Q1 2026. https://www.coutts.com/insights/property/coutts-london-prime-property-index-q1-2026.html
CPP Investments. (2025, January 13). CPP Investments forms joint venture with leading Brazil real estate developer Cyrela [Press release]. https://www.cppinvestments.com/newsroom/cpp-investments-forms-joint-venture-with-leading-brazil-real-estate-developer-cyrela/
DM Properties Marbella. (2025, August 29). Knight Frank: Prime Global Cities Index, Q2 2025. https://www.dmproperties.com/47175-knight-frank-prime-global-cities-index-q2-2025
Dubai Statistics Center. (2025). Population and vital statistics. Dubai.ae. https://www.dubai.ae/population-and-vital-statistics
Essential Business. (2026, May 14). Overseas purchases of property for refurbishment in Lisbon fall 12%. https://www.essential-business.pt/2026/05/14/overseas-purchases-of-property-for-refurbishment-in-lisbon-falls-12/
Global Citizen Solutions. (2025a). Global Passport Index 2025. https://www.globalcitizensolutions.com/global-passport-index/
Global Citizen Solutions. (2026a). Greece Golden Visa new rules 2026: Everything you should know. https://www.globalcitizensolutions.com/greece-golden-visa-new-rules/
Global Citizen Solutions. (2026b). Portugal Golden Visa changes, updates and developments 2026. https://www.globalcitizensolutions.com/portugal-golden-visa-changes/
GOV.UK. (2025). Stamp Duty Land Tax: Residential property rates. https://www.gov.uk/stamp-duty-land-tax/residential-property-rates
Greek City Times. (2025, December 26). Sharp decline in foreign direct investment in Greek real estate in 2025. https://greekcitytimes.com/2025/12/26/greece-real-estate-fdi-decline-2025-golden-visa-impact/
Günther, M., Lausberg, C., & Wechsler, M. (2022). Real estate ETNs in strategic asset allocation. Journal of Real Estate Portfolio Management, 28(1), 48–61. https://doi.org/10.1080/10835547.2022.2033390
HomeOwners Alliance. (2025, November 26). UK property tax changes 2026: How the “mansion tax” will work. https://hoa.org.uk/news/new-property-tax/
Iberian Property. (2025, May 21). Madrid approves the Reside Plan to limit tourist housing. https://www.iberian.property/news/residential/madrid-approves-the-reside-plan-to-limit-tourist-housing/
Idealista. (2026, April 22). The provinces where foreigners buy more than 20% of homes. https://www.idealista.com/en/news/property-for-sale-in-spain/2026/04/22/893833-the-provinces-where-foreigners-buy-more-than-20-of-homes
IMI Daily. (2025, August 26). South Korea imposes conditional ban on foreign property purchases. https://www.imidaily.com/asia-pacific/south-korea-imposes-conditional-ban-on-foreign-property-purchases/
Japan Living Life. (2026). Japan real estate market overview for foreign investors 2025. https://japanlivinglife.com/articles/japan-real-estate-market-overview
JLL. (2024). Global Real Estate Transparency Index 2024. https://www.jll.com/en-us/insights/global-real-estate-transparency-index
Jordà, Ò., Knoll, K., Kuvshinov, D., Schularick, M., & Taylor, A. M. (2019). The rate of return on everything, 1870–2015. The Quarterly Journal of Economics, 134(3), 1225–1298. https://doi.org/10.1093/qje/qjz012
Knight Frank. (2025a). Paris residential market insight. https://www.knightfrank.com/research/report-library/paris-residential-market-insight-2025-12165.aspx
Knight Frank. (2025b). Prime Global Cities Index Q2 2025. Knight Frank LLP. https://content.knightfrank.com/research/323/documents/en/prime-global-cities-index-q2-2025-12345.pdf
Knight Frank. (2026). The Wealth Report 2026. Knight Frank LLP. https://www.knightfrank.com/wealthreport
Lee, C. L. (2026). Portfolio asset allocation strategy for US unlisted sector-specific real estate across interest rate cycles. Buildings, 16(2), 308. https://doi.org/10.3390/buildings16020308
LonRes. (2026, April 30). Prime London Market Update Spring 2026. https://lonres.com/public/prime-london-market-update-spring-2026/
M3 Property. (2024, December 9). Foreign capital investment in the Australian property market for FY24. https://m3property.com.au/foreign-capital-investment-in-the-australian-property-market-for-fy24/
McKinsey & Company. (2026). Global private markets in real estate. https://www.mckinsey.com/industries/private-capital/our-insights/global-private-markets-report/real-estate
Office for National Statistics. (2026, June 17). Private rent and house prices, UK: June 2026. https://www.ons.gov.uk/economy/inflationandpriceindices/bulletins/privaterentandhousepricesuk/june2026
Patience Realty. (2025). Japan new condo supply hits lowest level since 1980 as prices remain strong. https://www.patiencerealty.com/post/japan-new-condo-supply-hits-lowest-level-since-1980-as-prices-remain-strong
PropertyLimBrothers. (2025, February 24). How Singapore’s property landscape has shifted for foreign buyers after three ABSD hikes. https://plbinsights.com/how-singapores-property-landscape-has-shifted-for-foreign-buyers-after-three-absd-hikes/
Provident Estate. (2026). Tax benefits for foreign property buyers in Dubai. https://providentestate.com/blog/tax-benefits-for-foreigners-in-dubai/
Savills. (2025a, January 28). Dubai’s residential real estate market shines in 2024 with record transactions and investor confidence. https://www.savills.com/insight-and-opinion/savills-news/372028/dubai-s-residential-real-estate-market-shines-in-2024-with-record-transactions-and-investor-confidence
Savills. (2025b, February 13). Rent and yield analysis. https://www.savills.com/research_articles/255800/372004-0
The Intermediary. (2026, February 26). London holds over half of England’s £84.2bn foreign-owned homes market, data finds. https://theintermediary.co.uk/2026/02/london-holds-over-half-of-englands-84-2bn-foreign-owned-homes-market-data-finds/
The National Herald. (2025). Greece’s real estate market, golden visas, magnet for foreign investors. https://www.thenationalherald.com/greeces-real-estate-market-golden-visas-magnet-for-foreign-investors/
The Portugal News. (2023, December 20). End of NHR and Golden Visa having little impact. https://www.theportugalnews.com/news/2023-12-20/end-of-nhr-and-golden-visa-having-little-impact/84393
The Rio Times. (2026, April 8). São Paulo luxury real estate up 22% a year. https://www.riotimesonline.com/sao-paulo-luxury-real-estate-10x-appreciation-2026/
UBS. (2025). UBS Global Family Office Report 2025. UBS Group AG. https://www.ubs.com/global/en/media/display-page-ndp/en-20250521-global-family-office-report-2025.html
UNCTAD. (2023). World Investment Report 2023. UN Trade and Development. https://unctad.org/publication/world-investment-report-2023
UNCTAD. (2025). Global foreign direct investment falls for the second consecutive year. UN Trade and Development. https://unctad.org/news/global-foreign-direct-investment-falls-second-consecutive-year-posing-acute-challenges
Urban Land Institute. (2024, August 27). After Surfside: New regulations and skyrocketing insurance premiums strain condo owners. Urban Land Magazine. https://urbanland.uli.org/resilience-and-sustainability/after-surfside-new-regulations-and-skyrocketing-insurance-premiums-strain-condo-owners