For global citizens, tax rarely comes down to a single headline rate. This briefing examines taxation from the perspective of an individual considering relocation, focusing on how jurisdictions treat individuals once they become residents. It looks at personal income, foreign income, capital gains, wealth, inheritance as well as the rules that apply when establishing or ending tax residence, including exit taxes and regime type. Together, these factors provide a clearer picture of the overall tax environment faced by internationally mobile individuals.

The briefing evaluates 48 jurisdictions across 11 indicators grouped into three pillars: Tax Burden, the direct cost of residence; Tax Structure, how a system treats foreign income and departing residents; and Investment Migration, the terms under which residence can be obtained. Tax Burden and Tax Structure are weighted equally, reflecting the view that how a tax system is structured can matter as much as the rates it charges. Considering these factors together adds a dimension often missing from existing comparisons, which typically assess tax systems separately from how an individual may obtain residence and mobility programs separately from the tax position that follows.
Jurisdiction Selection
The 48 jurisdictions were selected for their relevance to relocation and tax planning rather than economic size. They cover Europe, Latin America, the Caribbean, Asia-Pacific, Eurasia and the Middle East, Africa, North America, and Oceania. They fall into three groups: established destinations with residence or citizenship programs and tax regimes aimed at new residents; higher-burden systems included as reference points; and jurisdictions whose tax position is stronger than their current visibility suggests, including Uruguay, Paraguay, Georgia, and Mauritius.
Europe accounts for 20 of the 48 jurisdictions. This concentration reflects the distribution of preferential tax regimes rather than mobility programs, which are more widely spread. Of the 16 regimes for new residents identified in the briefing, 14 are European (EY, 2026).
What This Index Measures
The jurisdictions are evaluated across 11 indicators grouped into three pillars, selected for their practical bearing on where a mobile individual can efficiently establish tax residence.
Tax Burden measures the direct cost of residence: personal income tax, capital gains tax on listed securities, net wealth tax, and inheritance tax.
Tax Structure measures how a system treats internationally sourced income and departing residents: taxation basis, special regime type, exit taxation, and standard VAT rate. VAT is included because consumption is the base zero-income-tax jurisdictions rely on; without it they would appear untaxed rather than differently taxed.
Investment Migration measures accessibility: route type, minimum qualifying investment, and physical presence requirement. Investment Migration pillar counts programs granting residence or citizenship in exchange for investment. Jurisdictions qualifying on tax residency criteria alone (such as Uruguay) are captured under regime rather than mobility.
Data is drawn from the international tax reference publications maintained by the major professional services firms, principally PwC’s Worldwide Tax Summaries, with Deloitte and EY as secondary references. The data is supplemented by national revenue authorities and primary legislation, and by Global Citizen Solutions’ own indices. Where published summary rates diverge from the treatment applicable to resident individuals, the jurisdiction-specific source was used.
Rate indicators use the highest standard statutory rate applicable to a resident individual. Indicators are normalized on a 0–100 scale where higher values always favor the mobile individual, with minimum investment log-scaled across a range spanning two orders of magnitude and categorical indicators converted through a published scoring key.
The index weights Tax Burden and Tax Structure at 42.5% each, with Investment Migration taking the remaining 15%. Burden and Structure are equal on the reasoning that structural treatment of foreign income frequently determines outcomes more than headline rates do. Within that whole, taxation basis and special regime type carry the heaviest weight of any individual indicator, ahead of income tax and capital gains; physical presence leads the Investment Migration pillar, as the variable determining whether residence status creates tax residence. Where a jurisdiction operates no mobility program, weights renormalize across the remaining indicators rather than penalizing it for the absence of a commercial route.
Novelty
Two features distinguish this index from existing tax comparisons.
Structural treatment is weighted equally with rate burden. Conventional tax rankings compare headline rates. This index gives equal weight to whether foreign income is taxed at all, whether a preferential regime exists, and what departure costs. These dimensions determine outcomes for globally mobile individuals but remain invisible in rate-based comparisons.
Mobility is integrated with taxation. The index positions residence and citizenship programs alongside the tax consequences of using them, allowing entry cost and presence requirements to be read against the tax position they create.
Limitations
The index is a structured comparative tool rather than a comprehensive evaluation. Rate indicators reflect standard statutory rates and cannot express holding-period reliefs, relationship-dependent exemptions, or sub-national variation. Special regime coding captures mechanism but not duration, cost, or eligibility, which vary substantially between comparable regimes and in several cases restrict a regime to a narrow class of applicant. Minimum investment figures aggregate economically different commitments and, where a program prices by location, record the standard national threshold rather than the full schedule: Greece requires EUR 800,000 in Attica, Thessaloniki, and the larger islands, EUR 400,000 elsewhere, and EUR 250,000 for commercial conversions, of which the index records the general figure. Social security contributions, treaty coverage, and regime stability are not included in this edition.
With the method established, the results can be read. They begin with the composite ranking, where two jurisdictions charging 35% finish inside the top ten.

Tax optimization is the arrangement of one’s affairs, within the law, so as to minimize the tax legally due, through the deliberate use of allowances, reliefs, timing, entity and asset structuring, treaty provisions, and, for internationally mobile individuals, the choice of tax residence itself.
When tax optimization is approached from the standpoint of globalization, the broader shift is well captured by Dagan (2024), who observes that globalization has transformed the canonical account of the state: many people can now relocate and operate beyond state borders, drawing on goods and services offered by other jurisdictions, and this expansion of choice supports their liberty. The resulting task, in her framing, is to renew the social contract without rolling back the opportunities people have gained through globalization (Dagan, 2024).
Taxation sits at the center of that renegotiation, and literature shows it is not merely theoretical: Kleven et al. (2020) note that as globalization has lowered the cost of moving, “it has become increasingly important to pay attention to mobility responses when designing tax policy” (p. 119). Thus, their review documents both sides of the exchange: measurable relocation by high earners, and a wave of preferential tax regimes through which states now compete openly for them.
According to the OECD, the average tax-to-GDP ratio across its member countries reached 34.1% in 2024, an increase of 0.3 percentage points on the previous year, the first annual rise since 2021, and the highest average recorded for the 38 countries covered. Over the longer run, the average rose from 24.9% in 1965 to 33.7% in 2023 (OECD, 2025a, Ch. 1). That average conceals a wide spread: among the 36 countries with preliminary 2024 data, ratios ranged from 18.3% in Mexico to 45.2% in Denmark, the highest for the second consecutive year. Looking beyond the OECD, and on the same 2024 reference year, the average stood at 21.7% across Latin America and the Caribbean and 19.7% across 38 Asia-Pacific economies (OECD, 2026b, Ch. 1), while 2022 figures from the Global Revenue Statistics Database put the average at 31.6% for high-income countries against 18.9% for middle-income and 13.5% for low-income ones (OECD, 2025b, Ch. 2).
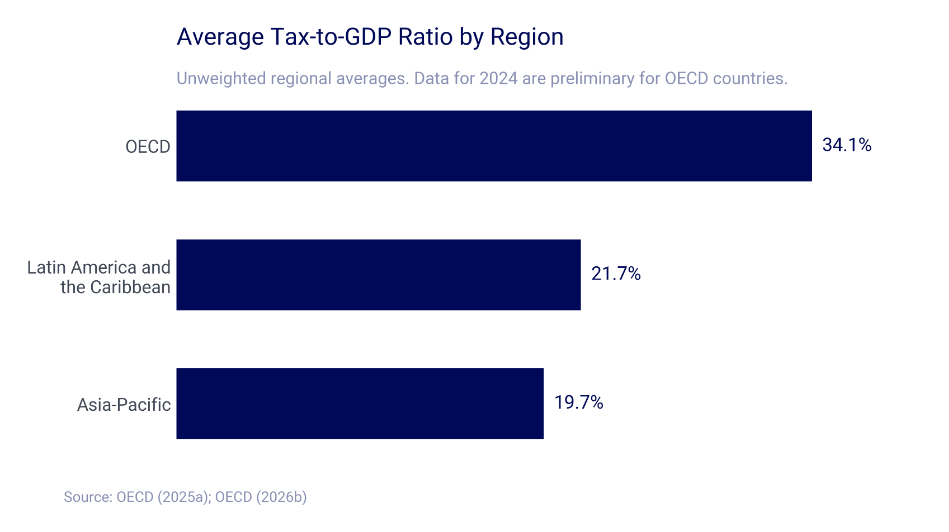
Chart 1. Regional ratio of tax to GDP
The burden also falls more on individuals than on companies: in 2023, social security contributions accounted for the largest share of OECD tax revenues at 25.5% and personal income tax the second largest at 23.7%, against 11.9% for corporate income tax. Where a person is resident is, in other words, among the most consequential financial variables in their life. Cross-border life on this scale now operates inside a mature administrative framework: 116 jurisdictions have commenced automatic exchanges of financial account information, covering over 171 million accounts worth nearly EUR 13 trillion in 2024 alone (OECD, 2025c). For an individual moving between jurisdictions, tax residence is therefore both a more common question than it has ever been, and one answered under far greater visibility.
Against that background, the question becomes a comparative one. If taxation is rising almost everywhere, and if where a person lives largely determines what they pay, then jurisdictions must differ from one another in ways that can be measured. What follows sets out how they were measured, and what that measurement found.
A different angle on the same question is worth keeping in view. The Tax Foundation’s International Tax Competitiveness Index ranks 38 OECD countries across 42 variables weighted toward corporate taxation and cross-border rules, and its results are dominated by Central and Eastern Europe: Estonia has led it for twelve consecutive years, with Latvia second, Lithuania fifth, Hungary ninth and the Czech Republic tenth (Mengden, 2025). Estonia and Latvia tax corporate profits only when distributed, Hungary levies the lowest corporate rate in the OECD at 9%, and Estonia, Latvia and Lithuania each secured deferrals from the global minimum tax rules to preserve those systems. The same index also measures treaty networks, which range from 132 agreements in the United Kingdom to 48 in Australia against an OECD average of 76 — a dimension not captured here, and one on which the Baltic states score poorly despite their overall position, each maintaining fewer than 65 agreements. Read alongside this briefing, it is a reminder that a jurisdiction’s attractiveness to a company and to a resident individual are measured on different variables, and that a region can lead on one while sitting mid-table on the other.
What does it take to lead an index of this kind? Not, it turns out, an extreme position on any single measure. The jurisdiction with the lowest tax burden does not lead, nor does the one with the most generous treatment of foreign income or the lowest cost of entry. Each of these strengths belongs to a different country, and none ranks first overall.
The strongest performers are jurisdictions that score well on what they charge, how their tax systems are structured, and the terms they offer to new residents. This combination is rarer than any single advantage, which is why the ten jurisdictions below are not simply the ten places with lower cost of living.
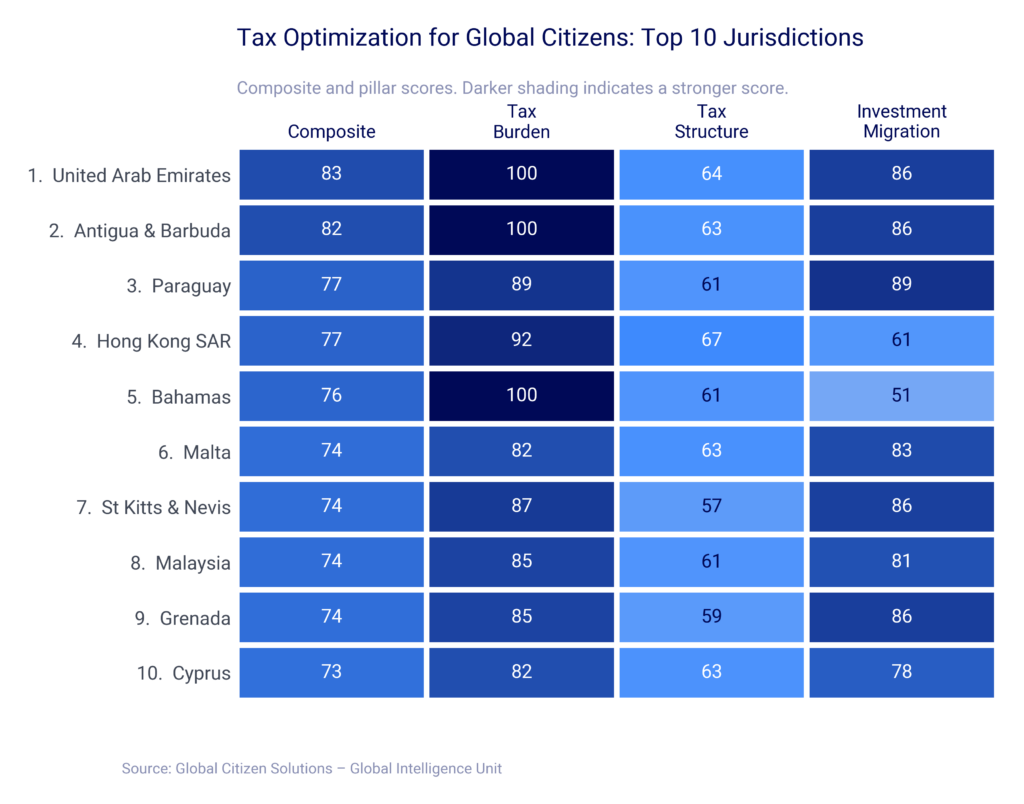
Chart 2. The Top Ten: Composite and Pillar Scores
Three routes lead into the top ten, and telling them apart matters more than the ordering itself, because each suits a different kind of person.
Charging zero. The United Arab Emirates, Antigua & Barbuda, the Bahamas, and St Kitts & Nevis levy no personal income tax, and nothing on wealth or succession either. The United Arab Emirates heads the index because it pairs that with a consumption tax of only 5% and no charge on departure, giving it a perfect Tax Burden score alongside a place in the top three for structure. Antigua & Barbuda follows on much the same profile, reached through a citizenship rather than a residence program. This route suits anyone whose income arises where they live, since there is no distinction to be drawn between local and foreign earnings when neither is taxed.
Charging narrowly. Paraguay, Hong Kong, Malaysia, and Grenada continue to tax income domestically at rates between 10% and 30%, but income arising abroad falls outside the charge altogether. The clearest illustration of the principle sits just outside this group. Uruguay charges 36% (PwC, 2026), a rate closer to Western Europe than to the Caribbean, yet records the strongest Tax Structure score in the sample by a wide margin, finishing twelfth overall on the strength of structure alone. This route suits anyone whose income arises somewhere other than where they intend to live.
Charging conditionally. Two European jurisdictions reach the top ten on this basis. Malta, sixth, charges 35% and taxes foreign income only when it is brought into the country, with a reduced rate available to those who qualify. Cyprus, tenth, taxes worldwide income at the same headline rate but exempts foreign dividends and interest for arriving residents who are not domiciled there. This is the most accessible of the three routes for a European resident and the least durable of them, since it depends on a regime that must be applied for and can be revised.
Geographically the group is concentrated: four Caribbean jurisdictions, two in Europe, two in Asia-Pacific, one in Latin America, and one in the Middle East.
The composite also conceals distinctions that would weigh heavily on anyone choosing between these places. Malta and the Bahamas are separated by less than two points, yet differ in cost of entry, treaty access, living conditions, and, most consequentially, in whether the favourable treatment is a standing feature of the tax code or a regime that must be applied for and may be revised. The ranking is a starting point for comparison rather than a substitute for one.
That division, between charging nothing and charging narrowly, runs through the entire index. It comes into focus once the three pillars are separated out.
Do the jurisdictions charging least also tax most narrowly, and admit new tax residents most readily? They do not. The three pillars measure different things and are led by different jurisdictions, and taking each in turn shows how little overlap exists between the three.
Tax Burden
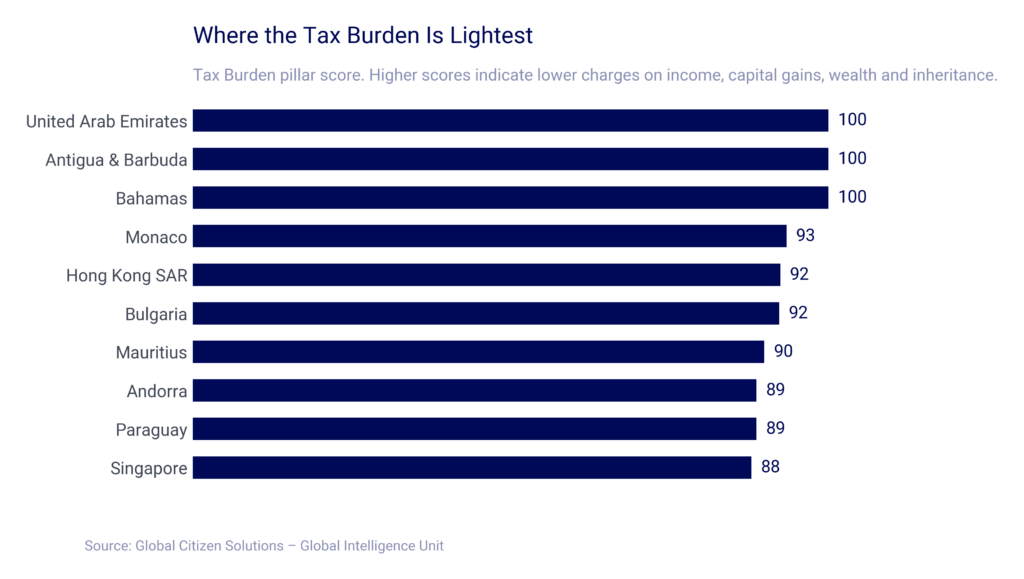
Chart 3. Leading Jurisdictions by Tax Burden
Tax Burden is led by jurisdictions levying no personal income tax at all. The United Arab Emirates, Antigua & Barbuda, and the Bahamas each record a perfect score, with Monaco and Hong Kong close behind. What sets the group apart is less the absence of income tax than the absence of everything alongside it: none levies a net wealth tax, and only Monaco charges inheritance tax, at 16% and on transfers outside the direct line. Net wealth taxes are rare across the whole sample, operating in only eight jurisdictions at rates running from 0.1% in Uruguay to 3.5% in Spain (PwC, 2026).
Strength in this pillar does not reliably carry through to the composite, however. Bulgaria finishes 20th overall, Monaco 16th, and Andorra 27th, since what a jurisdiction charges reveals nothing about what it charges on. That question belongs to the second pillar.
Tax Structure
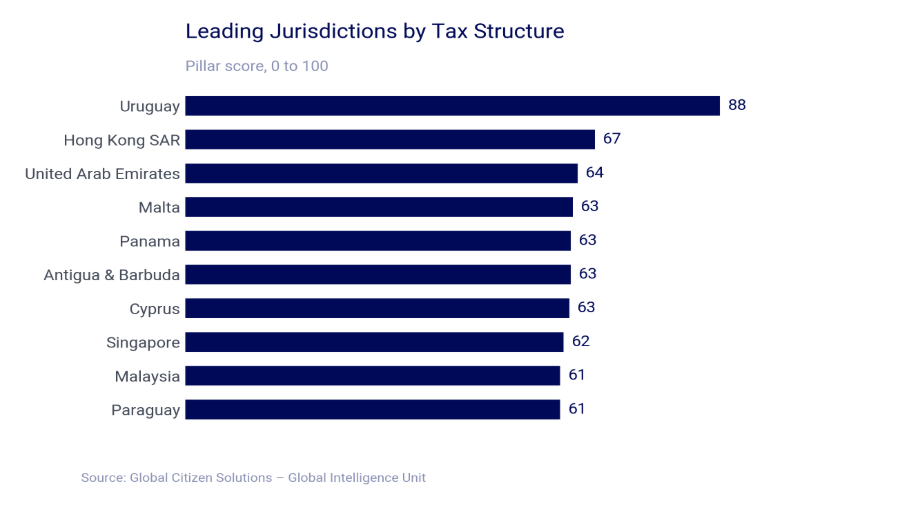
Chart 4. Leading Jurisdictions by Tax Structure
What happens when the measure shifts from what a system charges to how it is structured? The leaderboard changes almost entirely, and this is where the central argument of the briefing becomes clear. Uruguay leads with a score of 88, well ahead of Hong Kong and the United Arab Emirates. Below the leader, the field narrows sharply, with nine jurisdictions scoring between 61 and 67. Favorable tax structures are therefore both less common and less differentiated than low tax rates.
Two mechanisms account for a strong score. The first is a taxation basis that never reaches foreign income: nine jurisdictions tax only what arises within the country, and three tax foreign income only when it is brought in (PwC, 2026; Deloitte, 2026). Uruguay, Panama, Paraguay, Malaysia, and Hong Kong belong to the first group, whereas Malta, Mauritius, and Thailand to the second. The second is a preferential regime laid over a system that would otherwise tax worldwide income, exempting or reducing the charge for those who qualify, as in Cyprus, Ireland, Portugal, Italy, and Greece (EY, 2026).
Worldwide taxation as used here refers to the taxation of residents on income arising anywhere, the ordinary position across thirty of the 48 jurisdictions assessed (PwC, 2026; Deloitte, 2026), and it ceases to apply once residence ends. That is distinct from the taxation of citizens irrespective of where they live, which in this sample applies only in the United States and which relocation does not affect.
The two mechanisms differ, furthermore, in durability. A territorial basis is a standing feature of the tax code, applying to every resident indefinitely; a special regime is a time-limited concession, available to those who qualify and subject to revision by the government that granted it. Uruguay’s position reflects the first kind: a territorial basis, an election available to new residents, and no exit charge, operating together.
Investment Migration
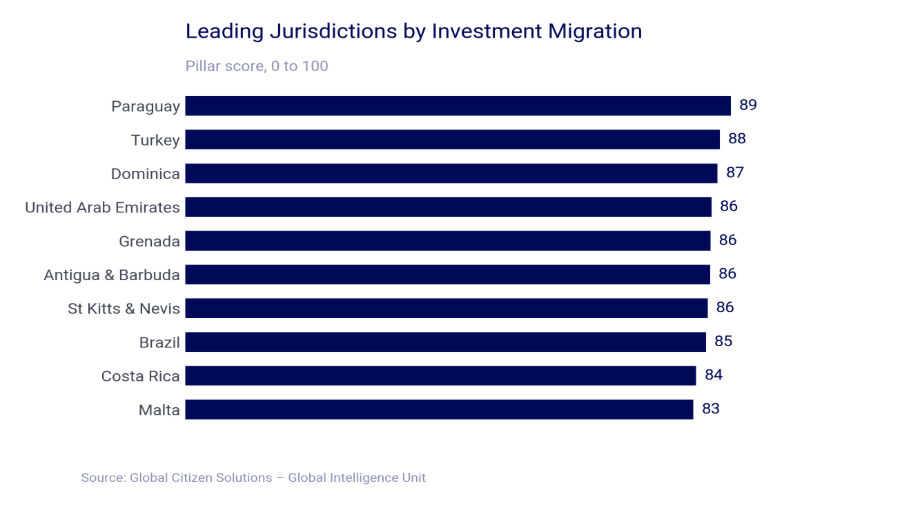
Chart 5. Leading Jurisdictions by Investment Migration
The third pillar measures the terms of admission rather than the cost of staying, and its leaders overlap with the other two only at the margins. Paraguay heads it on a qualifying investment of roughly USD 70,000 with no minimum stay, followed by Turkey and Dominica (Global Citizen Solutions, 2026b).
Entry costs vary widely, from Paraguay’s USD 70,000 to Singapore’s USD 7.4 million. To reflect this wide gap without allowing the most expensive programs to dominate the score, the indicator gives greater weight to affordability at the lower end of the range. It is not, however, the variable doing most of the work. Physical presence carries the greatest weight within the pillar, because holding a permit and being tax resident are separate statuses: a permit is granted under immigration law, while tax residence arises under the tax code, usually once 183 days have been spent in the country (PwC, 2026). Seven of the ten leaders here require no minimum stay at all, so residence can be held without the tax position moving.
Route type, moreover, separates the Caribbean from the rest: Dominica, Grenada, and Antigua & Barbuda offer citizenship programs at entry costs between USD 200,000 and 235,000, while Turkey alone operates both a residence and a citizenship route (Global Citizen Solutions, 2026b).
What does the completed dataset show that a headline rate would not? Read across the whole sample, the index produces a set of results that a rate-based comparison would either miss or reverse. The two dimensions weighted most heavily here, what a jurisdiction charges and how its system is built, prove to have very little bearing on one another: several jurisdictions charging 35% or more sit in the upper reaches of the ranking, while others charging 10% or 15% place far lower. What follows examines the jurisdictions at the heavy end of the scale, the cost of leaving any of them, and the objection most often raised against tax-led relocation.
High-Burden Systems
At the opposite end of the index sit Germany, Denmark, the United States, Japan, Spain, South Africa, France, Australia, Norway, and Canada. Nine are OECD members and five are in Europe. What they have in common is not simply higher rates but the presence of every burden category at once: residents taxed on worldwide income, capital gains taxed at or near income rates, substantial inheritance tax, and a charge on departure.
Succession separates this group from the leaders more sharply than any other indicator. Seven of these ten jurisdictions charge inheritance tax, several at rates above 40%, while none of the top thirteen in the index charges it at all. For an individual whose planning extends to succession rather than to annual income alone, this single indicator can outweigh every other figure in the table, and it is examined in detail later in this briefing.
These positions reflect deliberate policy design, however, rather than any deficiency. Each of these jurisdictions funds extensive public provision through taxation, and several rank among the most desirable places in the world to live. Within this index they serve as the comparative baseline against which the remainder of the sample is read.
The Cost of Leaving
What does it cost to leave? One element of structure deserves separate treatment here, since it constrains not where an individual may go but whether they can depart at all. Exit taxation charges the departing resident on gains that have accrued but not been realized, treating the departure itself as a disposal.
Thirty-one of the 48 jurisdictions impose no such charge. Of the seventeen that do, eleven apply a broad charge with deferral available — Australia, Canada, Denmark, Germany, Norway, Spain, France, Switzerland, Israel, Andorra, and South Africa. Five apply a narrower version, namely Portugal, the United Kingdom, the Netherlands, Japan, and Sweden. In contrast, Brazil, Mexico and Argentina all impose no exit charge. The United States sets the most demanding terms for deferral in the sample. Payment may be postponed asset by asset, but only against security acceptable to the Secretary of the Treasury, only if the expatriate permanently gives up any treaty protection against assessment or collection, and only with interest running until the tax is paid (26 U.S.C. § 877A(b); Internal Revenue Service, 2009). Canada and Germany also ask for security, though neither charges interest, and no other regime reviewed requires the treaty waiver.
For anyone holding appreciated assets, the practical lesson concerns sequence rather than destination. A charge falling due on departure can exceed several years of income tax in the country being left, so the timing of a move relative to a sale or other liquidity event often matters more than the choice of where to move. The index can flag this question but cannot resolve it, since the answer depends on what an individual actually holds. Any decision on when to end residence should therefore be taken with qualified tax advice in both the departing and receiving jurisdictions, given that the interaction of the two determines the final position.
Where Tax Meets Quality of Life
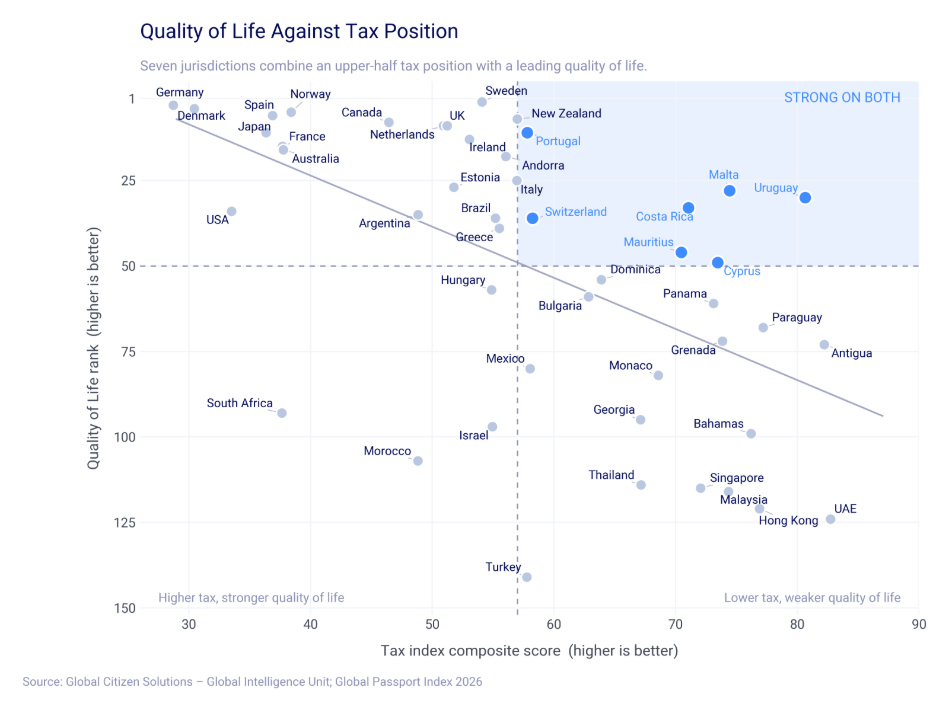
Chart 6. Quality of Life Against Tax Position
The most persistent objection to tax-led relocation is that the jurisdictions charging least are not the jurisdictions people most want to live in. Read against the Quality of Life pillar of the Global Passport Index 2026, which measures sustainable development, cost of living, happiness, personal freedoms, environmental performance, and migrant acceptance across 197 countries (Global Citizen Solutions, 2026a), the objection is broadly correct. Across the sample the two measures move together strongly and in the expected direction: the better a jurisdiction’s tax position, the lower it tends to place on living conditions.
At both extremes the pattern is unambiguous. Every jurisdiction ranking in the global top fifteen for quality of life sits in the lower third of this index: Sweden second in the world and 32nd here, Germany third and 48th, Denmark fourth and 47th, Norway fifth and 40th. The relationship holds in reverse at the other end: the United Arab Emirates ranks first in this index and 124th globally on living conditions, Hong Kong fourth and 121st, Singapore thirteenth and 115th. Jurisdictions that have built their proposition on the absence of personal taxation have not generally built it on the presence of what that pillar measures.
More instructive, however, are the exceptions. Seven jurisdictions place in the upper half of this index while also ranking inside the global top fifty for quality of life: Malta (6th here, 28th globally), Cyprus (10th and 49th), Uruguay (12th and 30th), Costa Rica (14th and 33rd), Mauritius (15th and 46th), Switzerland (21st and 36th), and Portugal (23rd and 11th).
What the seven share is decisive. Not one arrives at its position by charging no income tax. Uruguay, Costa Rica, and Mauritius operate territorial or remittance systems; Malta combines a remittance basis with a reduced-rate regime; Cyprus, Portugal, and Switzerland tax worldwide income with an exemption or flat-charge regime laid over it. Each is a developed or upper-middle-income economy with public services funded by taxation, which is exactly why each scores on living conditions, and each has chosen to compete for mobile residents through the structure of its tax system rather than through its rates.
The paradox therefore resolves in favor of this index’s central methodological choice. The trade-off between tax position and quality of life is real, but it binds only on the rate lever. A jurisdiction competing by charging little cannot simultaneously fund what that pillar measures. A jurisdiction competing through how it taxes foreign income can do both, and the seven that have done so are the only places in the sample offering a mobile individual a favorable tax position without a corresponding reduction in the conditions of daily life.
The remaining question is therefore not which jurisdiction performs best, but which performs best for a given individual.
Which jurisdiction, then, suits whom? The composite answers a general question, yet no relocation is undertaken in general terms. The indicators determining an outcome differ substantially between an entrepreneur approaching a liquidity event, a retiree living on accumulated capital, and a remote professional earning foreign-sourced income. Read around each of those situations, the same eleven indicators produce three different shortlists.
High-Net-Worth Individuals
For an individual with substantial accumulated capital the headline income tax rate is frequently the least important figure in the table. Income is often a small fraction of total wealth, and what matters instead is how the jurisdiction treats capital gains, net wealth, succession, and departure. Capital gains on listed securities are untaxed across much of the sample, including Hong Kong, Malaysia, Singapore, Malta, Cyprus, Grenada, and the Bahamas, while Australia charges 45% and Denmark 42% (PwC, 2026). Net wealth taxes are rare but compound annually where they exist, reaching 3.5% in Spain against Uruguay’s 0.1%.
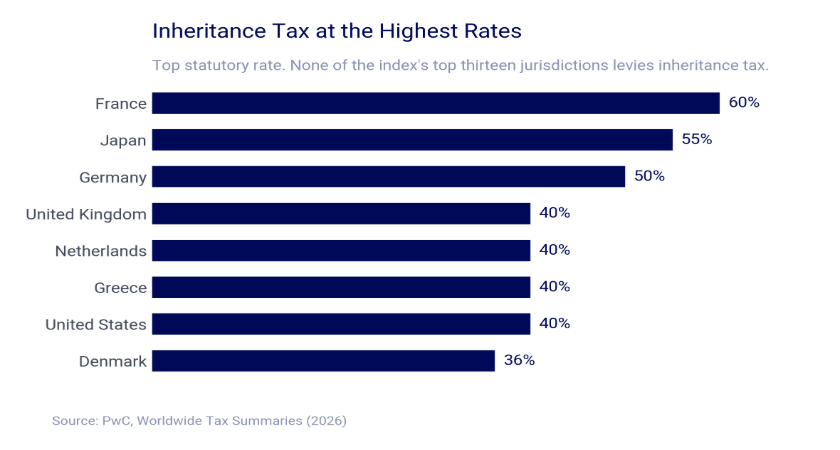
Chart 7. Inheritance Tax at the Highest Rates
Succession divides the field most sharply, and it is moreover the indicator most often absent from rate comparisons. France charges inheritance at up to 60%, Japan 55, and Germany 50 (PwC, 2026), while none of the top thirteen jurisdictions in this index charges it at all. Measured across a generation rather than a tax year, this single charge can outweigh two decades of difference in income tax.
Exit taxation governs whether the move can be made at all, and for this profile it is the first question rather than the last. In the United States the charge reaches only a covered expatriate, meaning an individual with net worth of USD 2 million or more, average annual income tax above USD 211,000 for 2026, or an inability to certify five years of compliance. One consequence reaches beyond the person leaving. Under section 2801 of the Internal Revenue Code, a US person who receives a gift or bequest from a covered expatriate is liable to tax at 40% on the value received above an annual exclusion of USD 19,000, with credits for foreign transfer tax paid and exclusions for spousal and charitable transfers. The liability falls on the American recipient rather than on the person who expatriated, and it does not expire: a transfer made many years after expatriation still triggers the charge (Internal Revenue Service, 2025). Where a family includes US-citizen children, this frequently exceeds the exit charge itself.
Two jurisdictions are built for this profile specifically. Switzerland taxes qualifying foreign nationals on a negotiated expenditure base rather than on worldwide income, and Italy substitutes a fixed annual charge for tax on all foreign-sourced income however large (EY, 2026). Other examples include Mauritius, which pairs a remittance basis with no charge on capital gains, wealth, succession or departure while remaining a conventional treaty-network economy, and Dominica, which offers the same four absences at the lowest citizenship entry cost in the sample.
Retirees
For a retiree the decisive variables shift. Pension treatment, healthcare, cost of living, and succession matter more than capital gains, and entry cost matters more than for a working-age applicant, since the intention is usually to move in fact rather than to hold an option. The jurisdictions escaping the quality of life trade-off map closely onto this profile: Uruguay, Costa Rica, Malta, Mauritius, and Cyprus each pair an upper-half tax position with a global top-fifty quality of life and functioning healthcare.
Consumption tax carries particular weight for this profile, since spending is high relative to declared income. On that measure Uruguay at 22% and Malta at 18 look less favorable than Costa Rica at 13 or Mauritius at 15, while the Bahamas at 10 and Antigua & Barbuda at 7 look better than their income tax position alone would suggest (PwC, 2026). Meanwhile, Panama, combines territorial taxation with a 7% consumption tax, no inheritance tax and no minimum stay.
Remote Professionals and Digital Nomads

For a remote professional the taxation basis is decisive, because income is foreign-sourced by construction. A territorial or remittance system does not merely reduce the charge on such income; in many cases it removes it altogether, which is why the twelve territorial and remittance jurisdictions in the sample occupy an outsized share of the index’s upper half. Entry cost and presence requirements also weigh more heavily here, since this group is younger and more likely to move again. Destination conditions for this profile are tracked separately in the Global Digital Nomad Index (Global Citizen Solutions, 2025). New Zealand has legislated the point directly: with effect from April 2026, a qualifying visitor may spend up to 275 days in any eighteen-month period without becoming tax resident, against the 183 days applying almost everywhere else. The same measure disregards that presence when determining whether the individual’s foreign employer has established a taxable presence in the country, removing the second obstacle that extended remote stays ordinarily create (New Zealand Inland Revenue, 2026).
Other examples include Malaysia, where a territorial basis leaves foreign earnings outside the charge entirely and the 30% headline rate reaches only locally arising income, and Thailand, which taxes foreign income only when it is remitted into the country, though the scope of that rule is currently under review.
One caveat applies with unusual force. Whether income counts as foreign-sourced turns on where the work is physically performed rather than on where the client is located, and a remote professional working from within a territorial jurisdiction may find the income treated as arising locally and taxable in full, notwithstanding that every client is abroad.
This briefing opened with four questions the headline rate cannot answer: whether foreign income falls within the charge, what relief is available on arrival, what departure costs, and whether residence gives rise to tax residence. The completed index shows that these are not refinements to a comparison organized around rates. They are the comparison.
The independence of rate and structure is the finding with the widest consequence. Uruguay charges 36% and finishes twelfth, ahead of fifteen jurisdictions that charge less, because income arising abroad falls outside its charge altogether. Hungary charges 15% and ranks 31st, because it reaches worldwide income and does not offer substantial tax benefits to arriving residents.
The same distinction resolves the objection most often raised against tax-led relocation, that the jurisdictions charging least are not the places people want to live. Measured against the quality of life data published in the Global Passport Index, the objection holds where jurisdictions compete on rates and dissolves where they compete on structure. Uruguay, Malta, Cyprus, Costa Rica, Mauritius, Switzerland and Portugal all place in the upper half of this index while ranking among the world’s leading jurisdictions for quality of life, and each arrives there through how it treats foreign income rather than through how little it charges.
What follows is not a single recommendation. The entrepreneur approaching a liquidity event is governed by capital gains treatment and the cost of departure, and for that profile the timing of a move matters more than its destination. The retiree is governed by succession, healthcare and consumption tax, which is why Panama, with a 7% consumption tax and no inheritance charge, suits that profile better than its twelfth place suggests. The remote professional is governed almost entirely by the taxation basis, which places Malaysia, charging 30% on locally arising income, alongside jurisdictions charging nothing at all.
One further consideration sits outside what this index measures but shapes how its results are used. A second residence or citizenship is increasingly understood in the terms an investor would apply to any other holding: as a means of not being wholly exposed to a single jurisdiction. Concentration risk is familiar when applied to assets and much less familiar when applied to the legal and political system under which a family lives, earns and eventually passes on what it has built, yet the exposure is of the same kind and the remedy is the same. Diversification here is not principally about paying less. It is about retaining the ability to act if the terms change, and the terms do change: Italy has repriced its regime twice in nine years, and preferential arrangements are creatures of legislation that the legislature can revise.
This is where the index is intended to be useful. Taxation appears in existing mobility research as one dimension among several; here it is the subject, measured across eleven indicators and read alongside the terms on which residence can be obtained. Together they describe something closer to the decision an internationally mobile individual is actually making: not where tax is lowest, but where a life can be arranged on terms that hold.
Data Sources
Deloitte. (2026). International tax highlights. Deloitte Touche Tohmatsu Limited. https://dits.deloitte.com/TaxGuides
EY. (2026). Worldwide personal tax and immigration guide 2026. Ernst & Young Global Limited.
Global Citizen Solutions. (2025). Global digital nomad report. https://www.globalcitizensolutions.com/global-digital-nomad-index/
Global Citizen Solutions. (2026a). Global Passport Index 2026: Quality of Life index. https://www.globalcitizensolutions.com/global-passport-index/quality-of-life-index/
Global Citizen Solutions. (2026b). Global Residency Programs Index 2026. https://www.globalcitizensolutions.com/report/2026-global-residency-programs-report/
Internal Revenue Service. (2009). Notice 2009-85: Guidance for expatriates under section 877A. https://www.irs.gov/pub/irs-drop/n-09-85.pdf
Internal Revenue Service. (2025). Instructions for Form 708 (https://www.irs.gov/pub/irs-pdf/i708.pdf)
Italian Republic. (2025). Legge 30 dicembre 2025, n. 199 (Legge di Bilancio 2026). Gazzetta Ufficiale della Repubblica Italiana.
New Zealand Inland Revenue. (2026). Tax residency status for individuals: Non-resident visitors. https://www.ird.govt.nz/international-tax/individuals/tax-residency-status-for-individuals
OECD. (2025a). Revenue statistics 2025: Disentangling personal income tax revenue in OECD countries. OECD Publishing. https://doi.org/10.1787/3a264267-en
OECD. (2025b). Tax policy reforms 2025. OECD Publishing. https://www.oecd.org/en/publications/tax-policy-reforms-2025_de648d27-en/full-report/tax-revenue-context_80e66aad.html
OECD. (2025c). Peer review of the automatic exchange of financial account information: 2025 update. OECD Publishing. https://www.oecd.org/en/publications/peer-review-of-the-automatic-exchange-of-financial-account-information-2025-update_bbf150e4-en.html
PwC. (2026). Worldwide tax summaries: Individual taxes. PricewaterhouseCoopers International Limited. https://taxsummaries.pwc.com/
Literature
Dagan, T. (2024). Tax and globalisation: Toward a new social contract. Oxford Journal of Legal Studies, 44(3), 487–508. https://doi.org/10.1093/ojls/gqae010
Mengden, A. (2025). International Tax Competitiveness Index 2025. Tax Foundation.
Kleven, H., Landais, C., Muñoz, M., & Stantcheva, S. (2020). Taxation and migration: Evidence and policy implications. Journal of Economic Perspectives, 34(2), 119–142. https://doi.org/10.1257/jep.34.2.119
Tax responsibilities of expatriation, 26 U.S.C. § 877A. Office of the Law Revision Counsel. https://uscode.house.gov/view.xhtml?req=%28title%3A26+section%3A877A+edition%3Aprelim%29
All 48 jurisdictions with composite and pillar scores. Investmen t Migration is recorded as not applicable where the jurisdiction operates no program; in those cases the composite is calculated on the remaining indicators renormalized to 100%.